Google Analytics 4 is filled with reports and data you will never look at. On the other hand, there are for sure metrics that are missing. Custom reports in GA4 can solve those two annoyances and make web analytics 100% useful to your business. Let’s learn how to cut out the clutter and focus on what matters.
Highlights
- You can create custom reports in GA4 and make the tool more useful to you.
- You can change or build detail and overview reports or explorations.
- Some custom reports don’t require any skills, but are yet useful.
- A critical mind can save you from analysis paralysis.
Benefits of custom GA4 reports
For most sites, web shops and apps, you can find relevant data in the standard pre-configured GA4 reports.
But the tool is not a one-size-fits-all web analytics solution. And that is its beauty because it opens a world of custom analytics reports.
- You can build and customize reports in GA4. That in itself is an enormous advantage over some web analytics tools that have fixed dashboards and reports.
- Even beginners can customize a report in GA4. Changing a default built-in dimension requires no special skills, as I demonstrate below. Yet, even smart small changes to reports result in more marketing focus, a fluent analytics flow, and faster business-decision actions.
- At the other end of the spectrum, you can also build fully customized reports in GA4 that are completely tailored to analyze and hence improve your site, marketing strategy and business.
In brief:
Data overload is a focus killer. Data underload is a business killer.
This is why GA4 custom reports deserve a spot on your busy agenda.
Ready for a trip like this?

Let’s begin with the easiest stuff…
How do I create a custom report in GA4?
In GA4, you can create a custom report in two different ways. Either you create a fully customized report with a blank or template exploration. Or you create or adapt a detail or overview report and save it as a new one.
That’s a lot of information to take in if you are a beginner. But don’t worry, the details and steps will become clear.
The basic flow of custom reports is:
- Define your data needs
- Check which existing reports provide a good basis for your analysis
- Customize or build a report from scratch
- Save the report
- Optionally, add it to the GA4 navigation menu
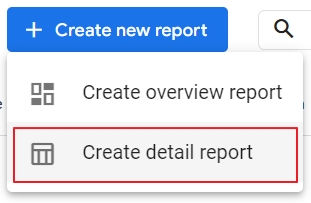
You can create a (detail or overview) report by going to
Reports > Library > Click Create new report > Choose Create Overview Report or Create Detail report.

There is also an easier way and it’s recommended if
- you are at the beginning of your GA4 journey
- or just want to get a feel of what’s possible
Once you do the following, the steps to create a report from scratch becomes so much easier.
How to adapt an existing report in GA4?
If you have admin or editor access rights to GA4, you can adapt existing overview and detail reports in GA4. These are listed under Reports in the left menu. You can save your changes as custom reports.
The steps to do so are always the same.
Step 1: Click on Reports and choose a report
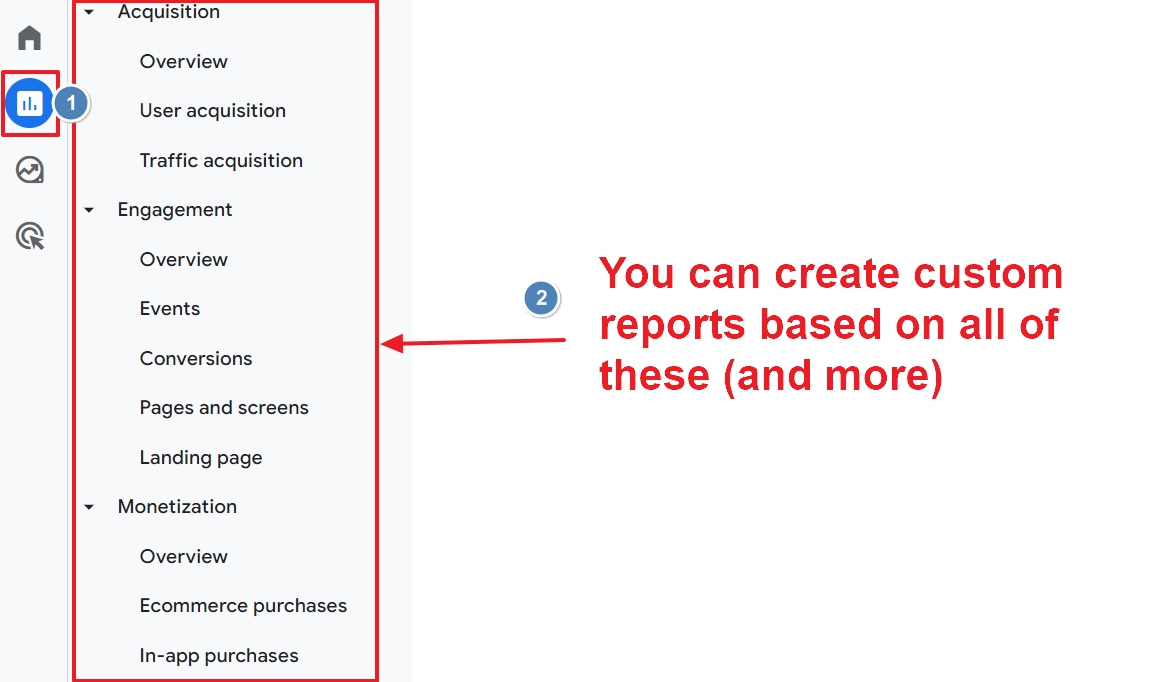
You can pick Reports snapshot or one of the reports within the available categories:
Life cycle
Acquisition (e.g.: traffic)
Engagement
Monetization
Retention
User
Demographics
Tech
Step 2: Click on the Customize report icon
The icon is floating in the top right corner.
Step 3: Customize the elements of your reports
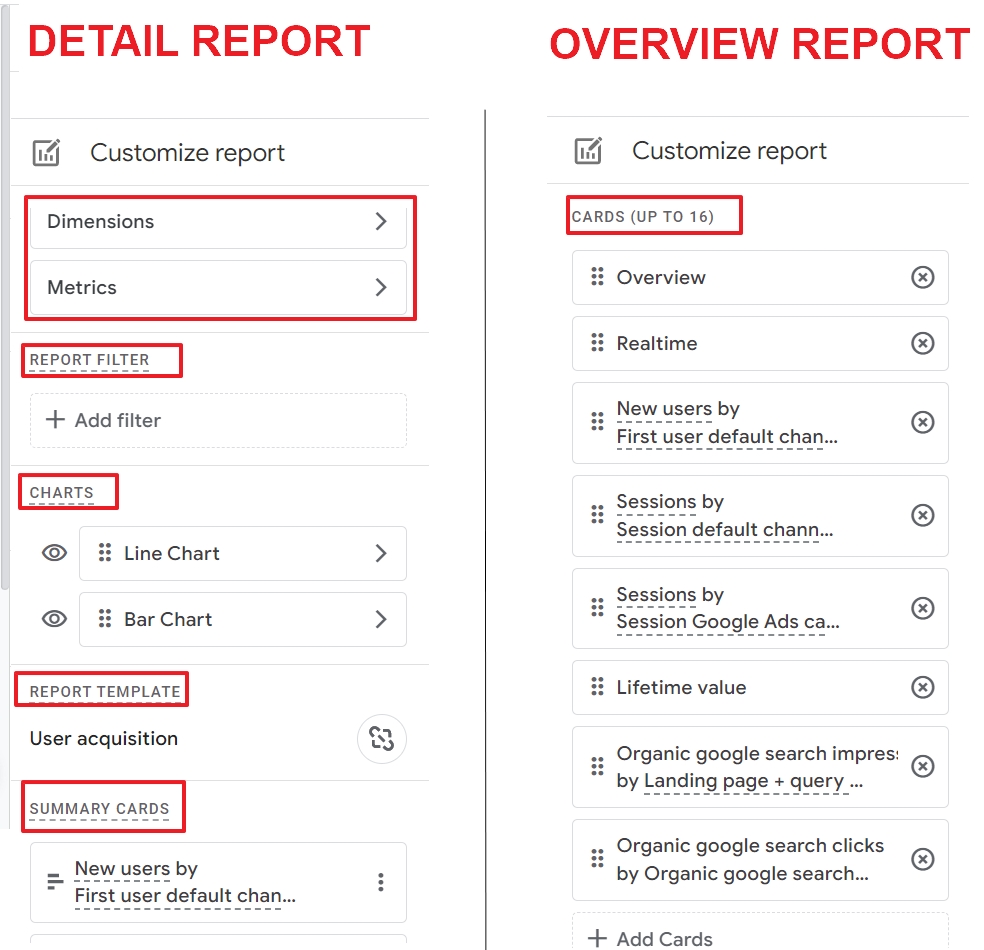
Depending on whether you picked a detail or an overview report, you will see a panel with different options.
Overview report
Cards only (up to 16)
Detail report
Dimensions
Metrics
Report filter
Charts
Summary cards
Step 4: Save your report
You can Save the report, but that is not recommended if you are customizing one of the built-in GA4 reports. You may lose vital information that was included in the report or miss out on future features.
A better option is to click on Save as a new report.
Fill in a descriptive name. Optionally, describe the purpose of the report for your team members.
Those are the basic steps.
Let’s zoom in on step 3 and see what you can change to get more useful detail reports.

Customizing a GA4 detail report
Detail reports have a fixed layout. They consist of 2 charts and a table below. In the table, you can use two dimensions. You cannot add extra elements to the report.

That may sound as if you cannot customize a lot, but that changes the moment you open the report customize panel.
The way to do this is to click on the Customize report icon.
PRO TIP: It’s best to save a copy of the report first. This way, you can see some changes happening while you are building your new report.

Choosing different dimensions
You can choose another default dimension. This is used in both the chart and as the primary dimension of your report.

You can also reorder and remove dimensions from reports. On top of that, you can add your own custom dimensions.

A good usage example is to create a new report when you have configured custom channel groups. You can also apply this to the landing page report.
Changing metrics of your report
Not all default metrics in report tables are relevant to you. You can change them, delete and add new ones. That is, for example useful if you don't want an event value in your conversions report. Or if you want to add, for example, predictive metrics to other reports.

Mind: not all metrics and dimensions are actually pulling data in your report.
Report filter
A report filter in GA4 is useful to exclude or include certain values of dimensions.

You can, for example, use this to create a separate report with a segment of your audience. Or you can use it to create an acquisition report for visits from your email campaigns.
Charts
A detail report has a maximum of 2 charts. You can reorder or hide them, or alter the visual layout of a chart into a:
- Bar chart
- Scatter chart
- Line chart

A good usage example is if you’re tracking QR codes campaigns in GA4. You can then create a custom report with a chart like this:

Summary cards
In the detail report customizer, you can edit, delete and create custom summary cards.

You can customize the:
- Dimensions
- Metrics
- Visualization
- Card filter

The strange thing is that these custom cards won’t be displayed in your detail reports.
But you can use them in your overview reports.
Speaking of which…
Customizing GA4 overview reports
Overview reports are ideal to get a quick glance at some aspects of your analytics. The data is presented as cards and every report can have a maximum of 16.
To access overview reports, click on Reports in the menu on the left.

Then pick your choice:
Report Snapshots (overview)
Category Life cycle
- Monetization overview report
- Engagement overview report
- Acquisition overview report
- Retention overview report
Category User
- Demographics overview
- Tech Overview
To customize an overview report, click on the pencil icon on the top right corner.
In the side panel, you can
- Reorder the position of the card by dragging it to the position you want. The higher on the list, the higher it will appear in your report.
- Delete a card from the report
- Add a new (pre-configured) card

If you add a card, you have a myriad of options to choose from. Browse, select and add.

The cards are categorized into
- Summary cards
- Business cards
- Life Cycle
- User
- Other cards
While customizing the report, you can see the changes happening live.
This only happens if you save the report as a new one. So, you may as well do the last step before doing anything else.
Happy with the new structure of your report? Then you can save it, or save the report as a new report.

Nice, isn’t it? Getting rid of the clutter and staring value straight in the eyes?
Let’s take it a step further.
Exploration reports: full custom reports
Explorations allow you to build fully customized reports with more than 2 dimensions, as is the case with the detail reports.
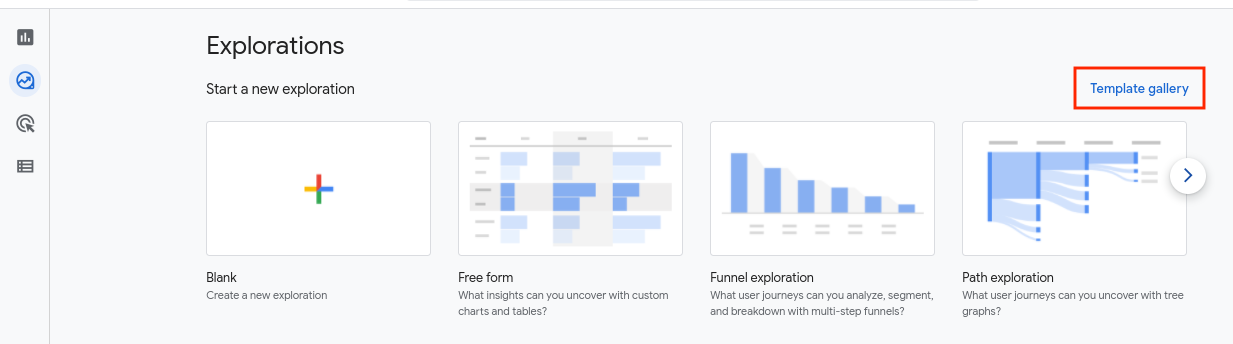
You can either start from scratch or you can pick one of the available templates and build your report.
Explorations are a separate section in the menu on the left.

Then click on Template gallery.
And here you have a library of template reports grouped into
- Techniques
- Use cases
- Industries
You can find more information in our in-depth guide on how to use exploration reports.
The following resources will also either inspire you, or guide you through the steps on customizing explorations.
- Create a custom segment overlap report
- Create a report for file downloads
- Create an error 404 monitoring
- Create a custom user lifetime report
As you have understood, the sky’s the limit in GA4. I did not cover everything to not overwhelm you and left some questions for the end.
Useful FAQ
Can you create a custom home report in GA4?
No, you can’t. But you can personalize the metrics of the GA4 home report. If you share your account with others, they won’t see the metrics you have selected.
This is useful if you want to see, for example, engagement rate metrics instead of the default ones.

Can you create a custom real-time report in GA4?
No, that’s not possible. The GA4 real-time report is interactive and you can build comparisons or select dimensions and metrics. But you can’t add, change or remove elements from it and save it as a new report.
Despite this limitation, there is a lot you can do with it, as you can find in this article.
How do I download custom reports in GA4?
You can download the data from your custom reports as any other report. Click on the share icon on the right top corner and then on download.

The format can be either a pdf with the charts, or a CSV file with the data neatly presented in tables and columns.
What does unlink report mean in GA4?
When you customize a report (overview or detail) in GA4, you can unlink it from the underlying report template. This way, your custom report won’t receive any future updates from GA4. The data, however, will be available in your report.

Where do I find custom reports in GA4?
All your GA4 custom reports are in the Library of the Reports section. You can access them from here and see details such as the template it was based on, the creator, and the name of the report.

When you click on the 3 dots next to a report, you can also edit, rename, make a copy, delete your report.

Can I create a custom Reports Snapshot?
Yes you can and you probably want to do so, because the Reports snapshot is the overview report of the overview reports.
Zoomed out, you can see there are quite a few visuals and charts.

As with creating GA4 detail reports from scratch, this is easier when you first create a couple of overview reports based on existing ones. Then, you can create a new report in your Library (under Reports).
When you click on the 3 dots next, you can set your custom report as Reports Snapshot.

Final note
Creating customer reports in GA4 is fun and sometimes way too easy. The most important and challenging part is the strategic thinking up front.
- Do you really need a custom report? (Or can you get the data in a faster or other way)?
- What is it that you want to track exactly?
- What are you going to do with the data? Stare at it or change your site, marketing strategy, or even your business model?
- Have you outlined a data strategy?
- Is your team in the loop of your customizations?
- Is your GA4 account set up to actually collect the data that you need?
GA4 is just a tool. A good one, but a tool.