
EVENTS REPORT
Everything in GA4 is an event, but the events reports have special meaning!

You might have heard that Google Analytics 4 is an event-based model as opposed to a hit-based model, but what does that mean in practice?
Hits vs Events
With the old Universal Analytics model, each user is identified either by cookies on a device or by their user ID (in the case that they have to log in to use your site). Connected to each user is a number of sessions – or every 30-minute window they are using your site – and within that session everything they do is recorded as ‘hits’.
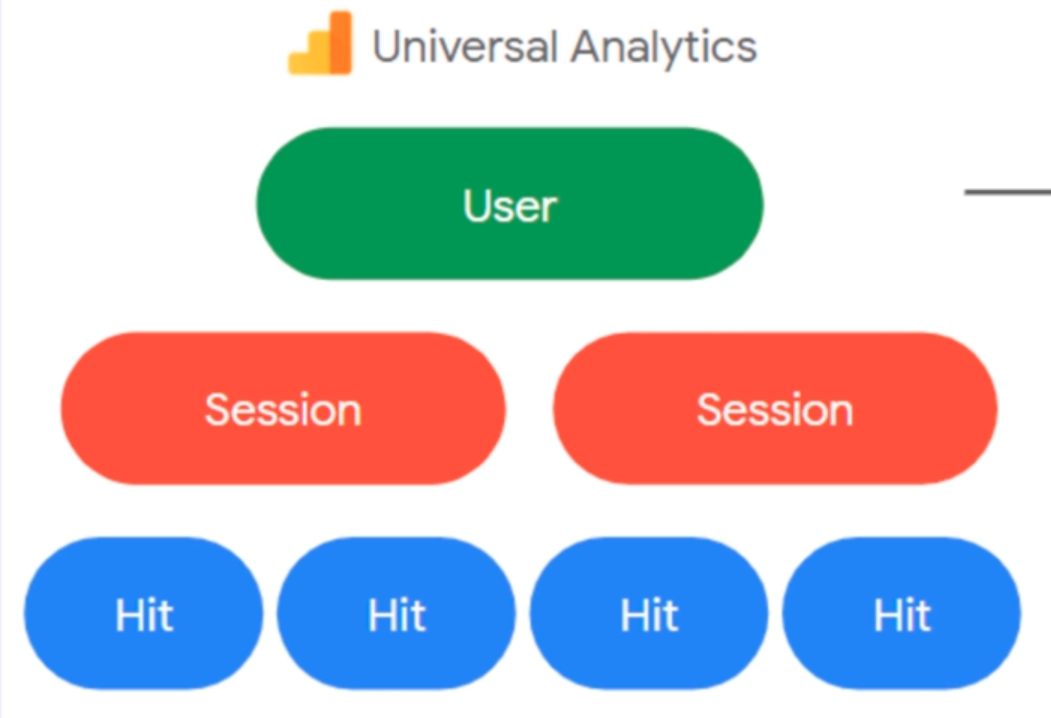
The ‘hits’ systems can be difficult to manage and track as hits could fall into many different categories e.g. page views, social interactions, ecommerce, etc.
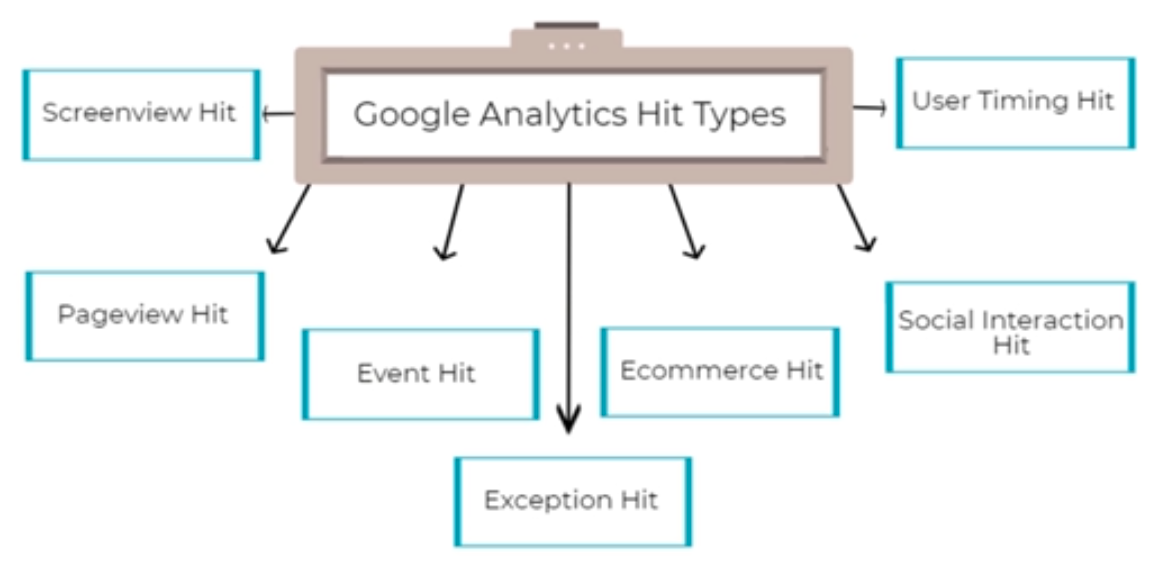
Things get complicated when trying to figure out the scope of your hits.
With GA4 the model is much simpler because you have a user with user properties connected to them. User properties could be used to separate customers from non-customers, for example. Then, you have an event with different parameters around it, which gives you much more flexibility around the event.
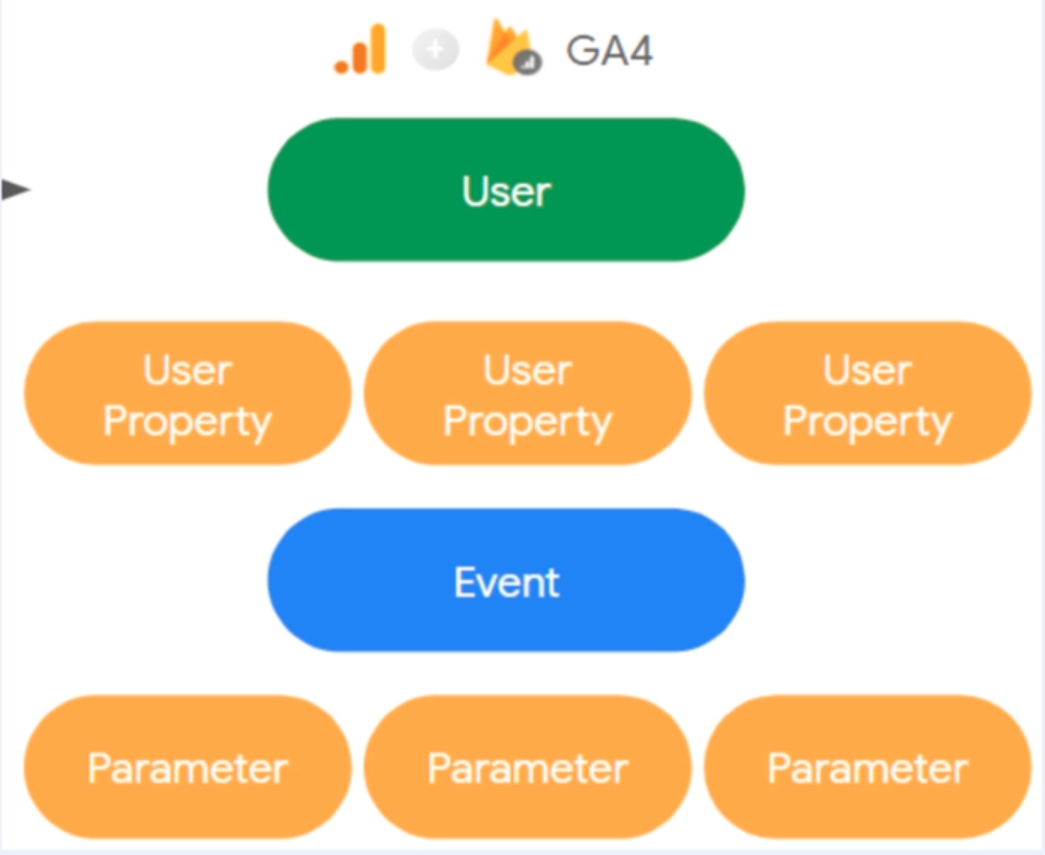
There are an unlimited number of parameters and customer properties you can have to measure your data, which makes this model much more flexible than the old one. However, to get the most out of it you need to spend more time setting it up. For example, to view event parameters in the GA4 interface, you need to map them out as custom dimensions.
The limit for custom dimensions is 50, which is more than the 20 you had in Universal Analytics and should be more than enough for most implementations (with the exception of enterprise).
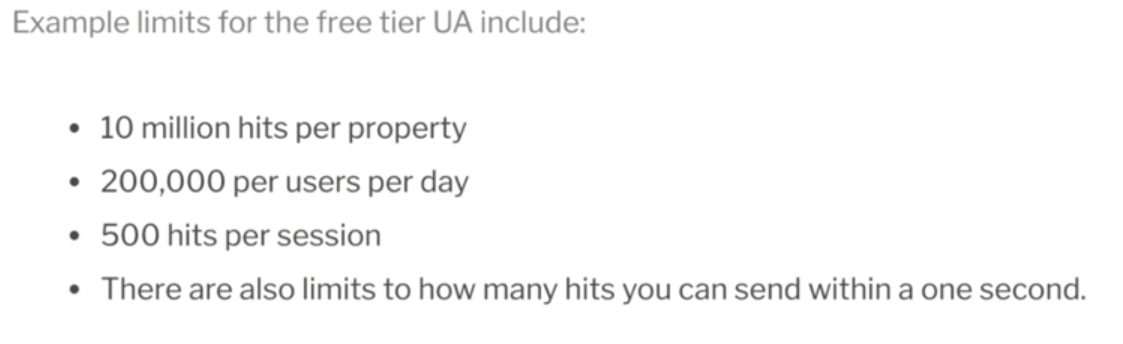
One of the main benefits of using the event-based data model is that it uses significantly less data storage. This allows Google to remove all limits from GA4, which is a huge advantage (if you wanted to surpass the limits it had on Universal Analytics, you would need to switch to GA360).
Universal Analytics puts the following limits on accounts:
Creating Custom Dimensions
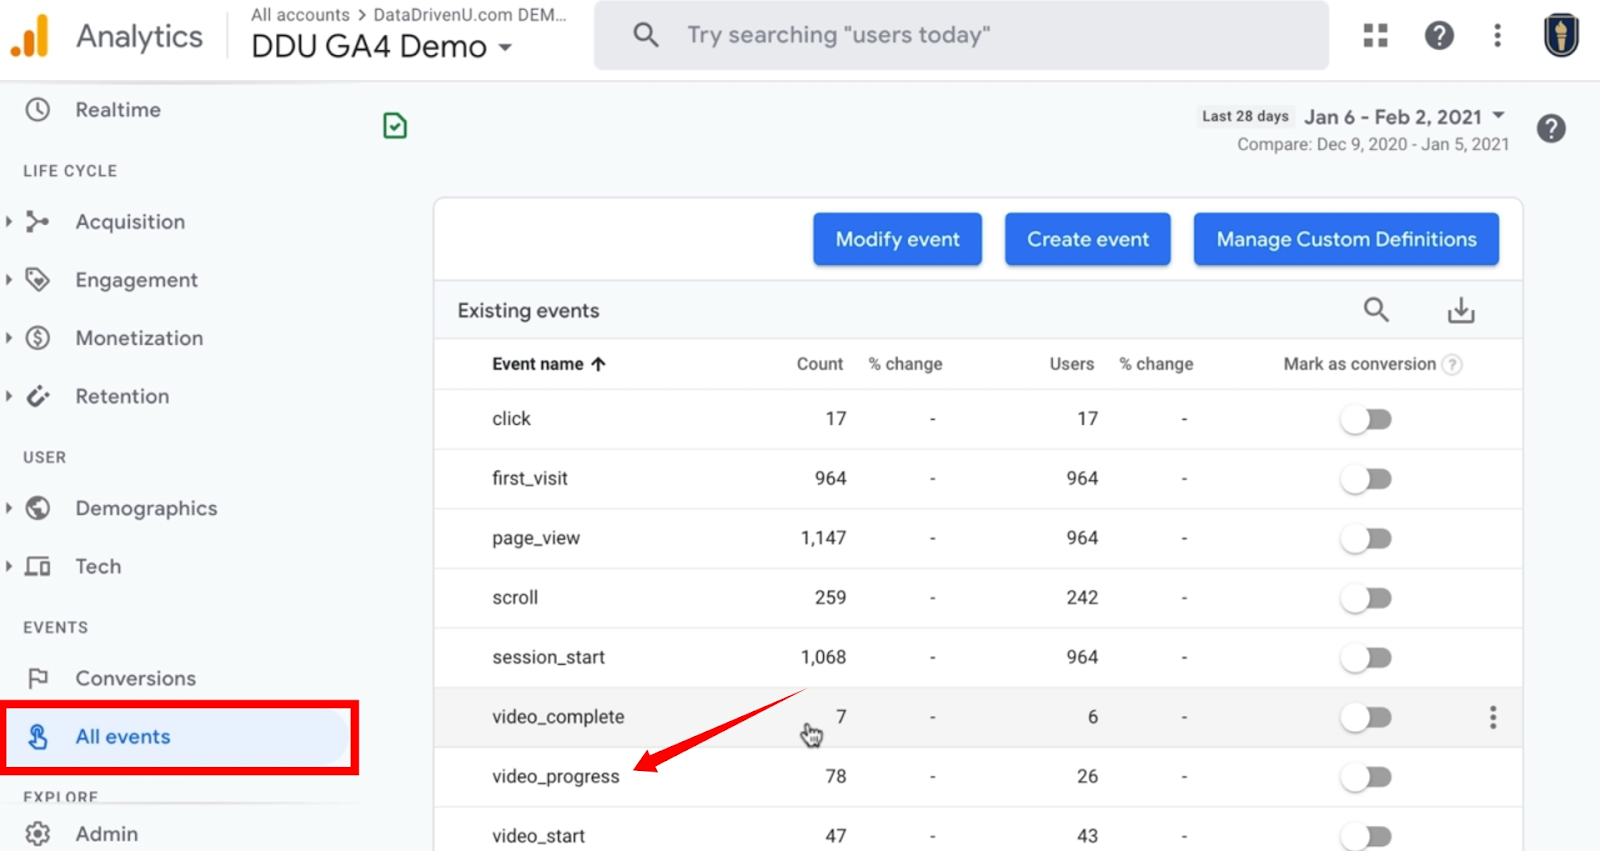
Let’s take a look at some automatically collected events in GA4 and their parameters.
On the Events screen you can see the existing events that are being collected. For example, there is one event called Video Progress which measures how far users get through a video.
Click on Video Progress to visit the page and scroll down to the parameters section. Click on the dropdown to select different parameters.
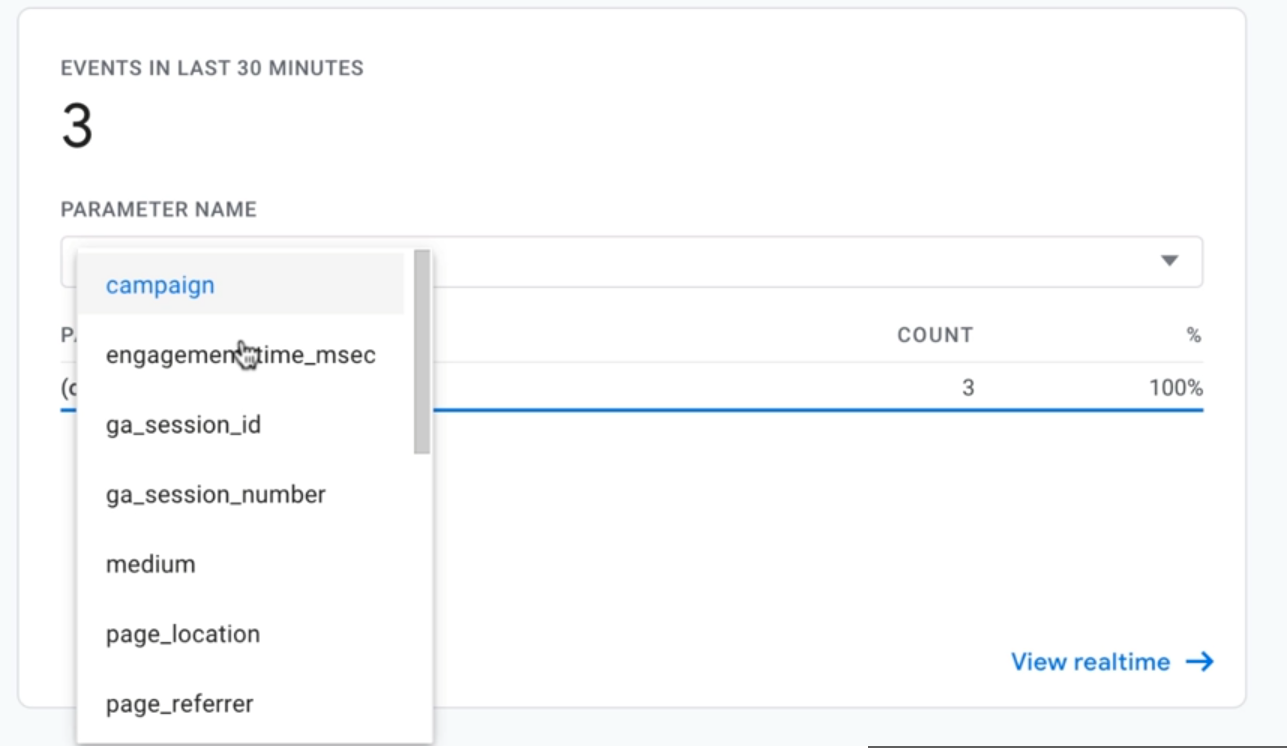
For example, select video_percent to see how many users got through 25%, 50% or 75% of the video. 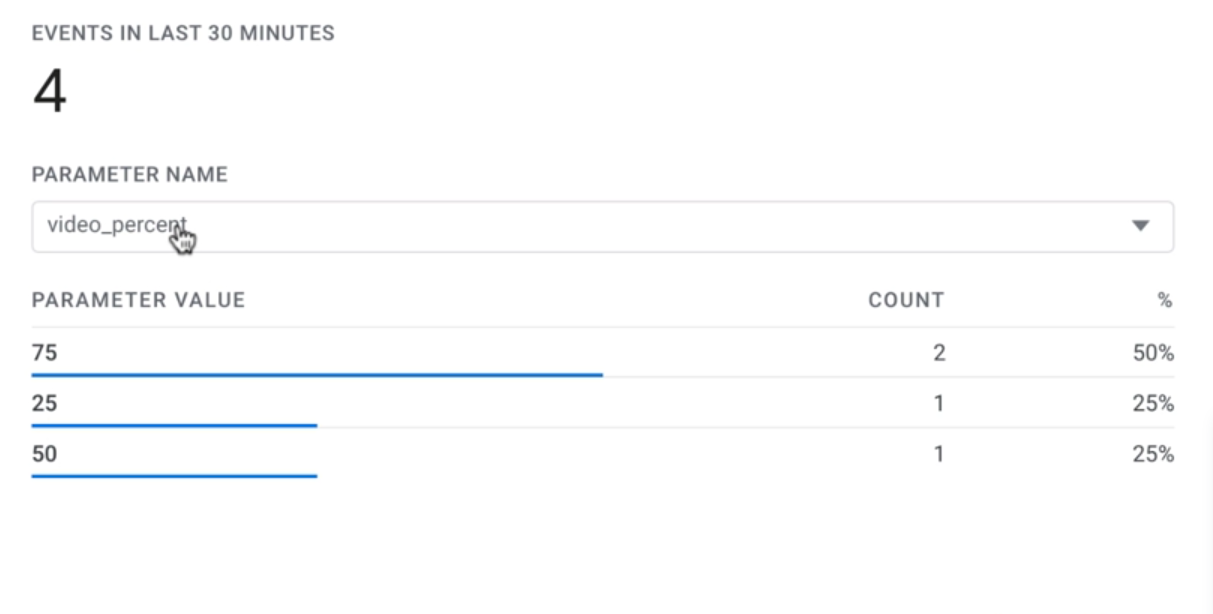
This report only shows real time results for this data, so you can only see what’s been happening in the last 30 minutes. To put this parameter into a report so you can view it for any time period, you need to create a custom dimension.
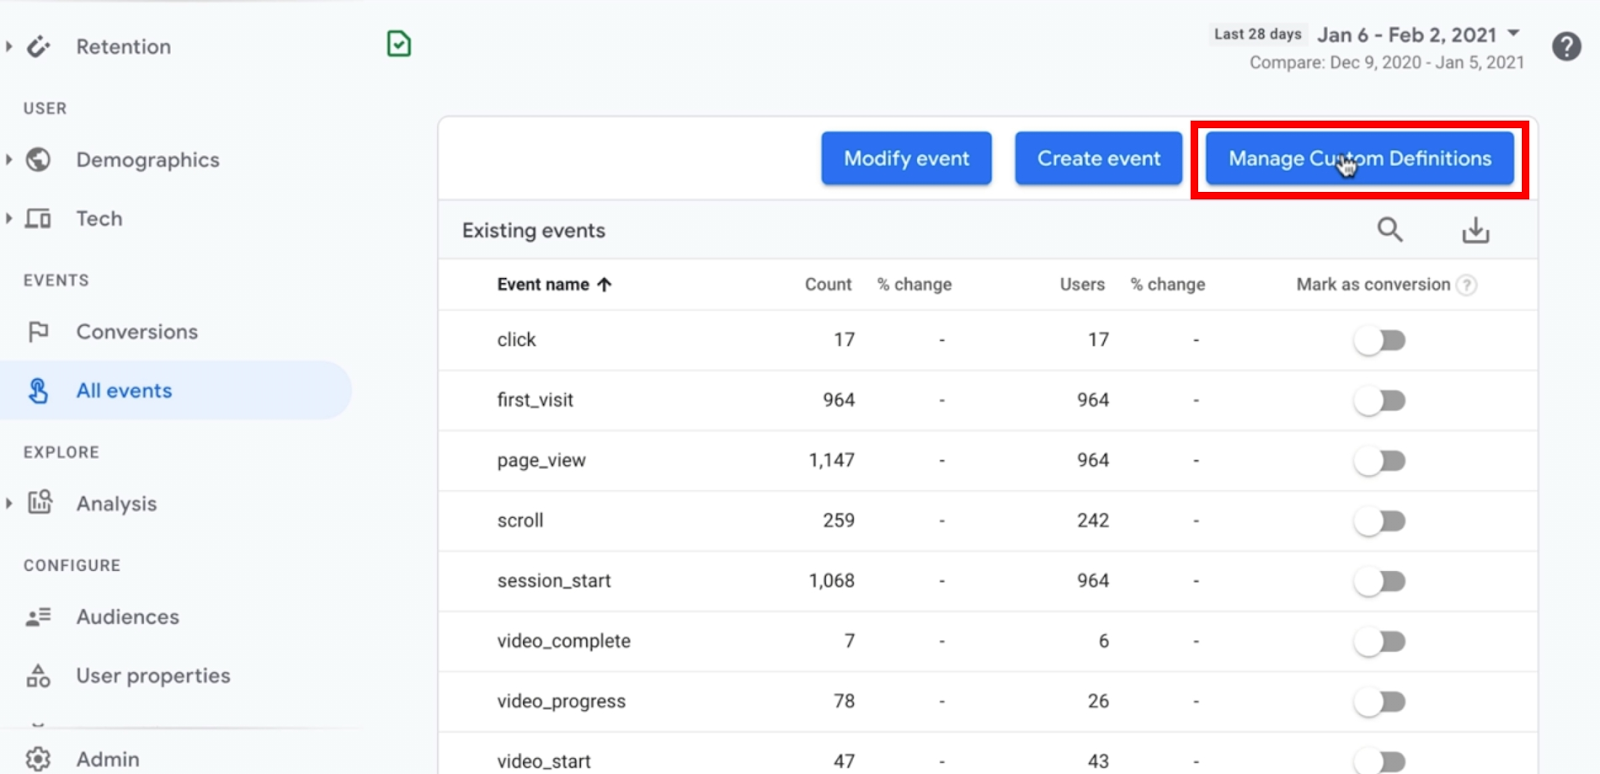
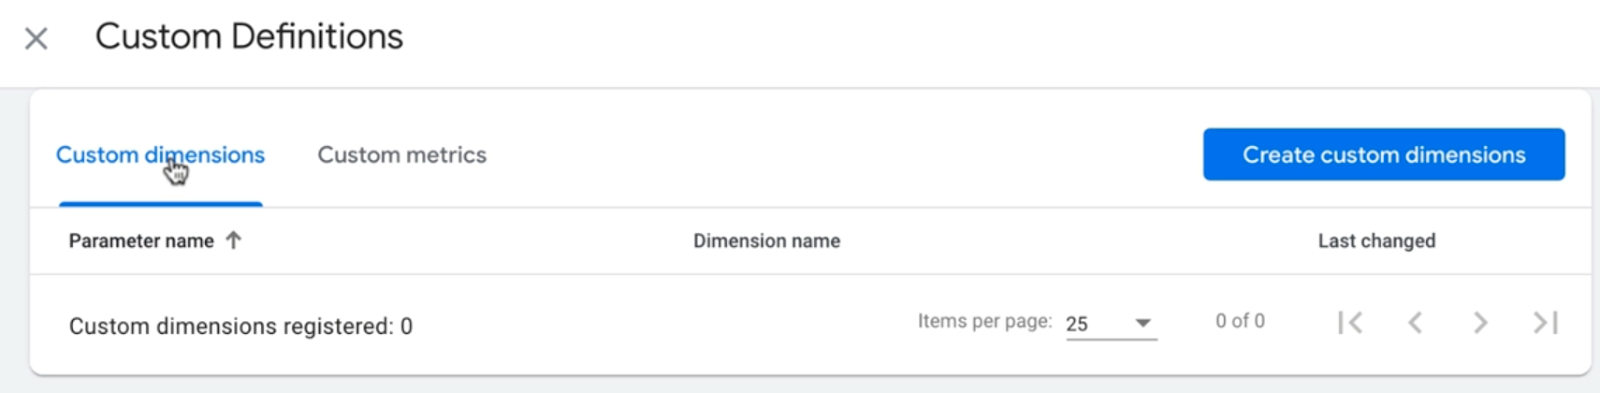
Back on the main Events page, click Manage Custom Definitions.
Then, in Custom Definitions, click Create Custom Dimension.
Find the parameter name of the parameter you want to measure and then add a custom name according to whatever naming conventions you are using.
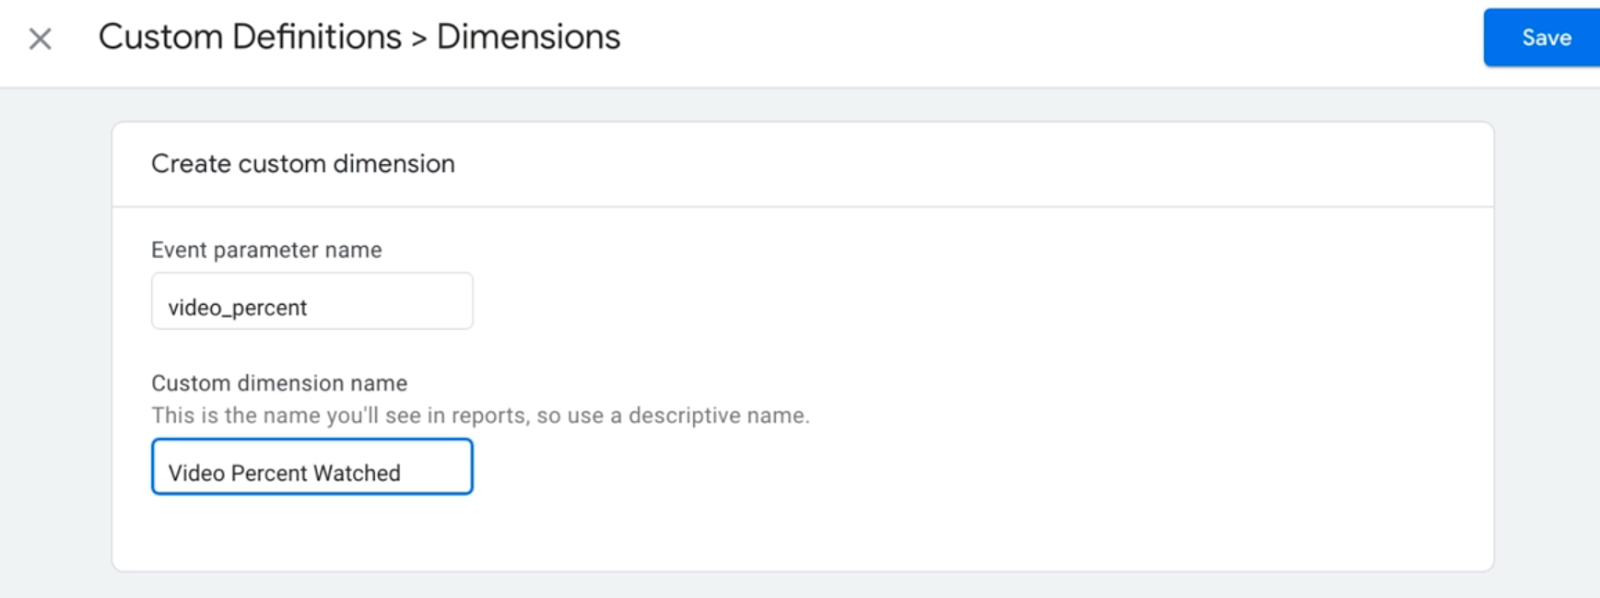
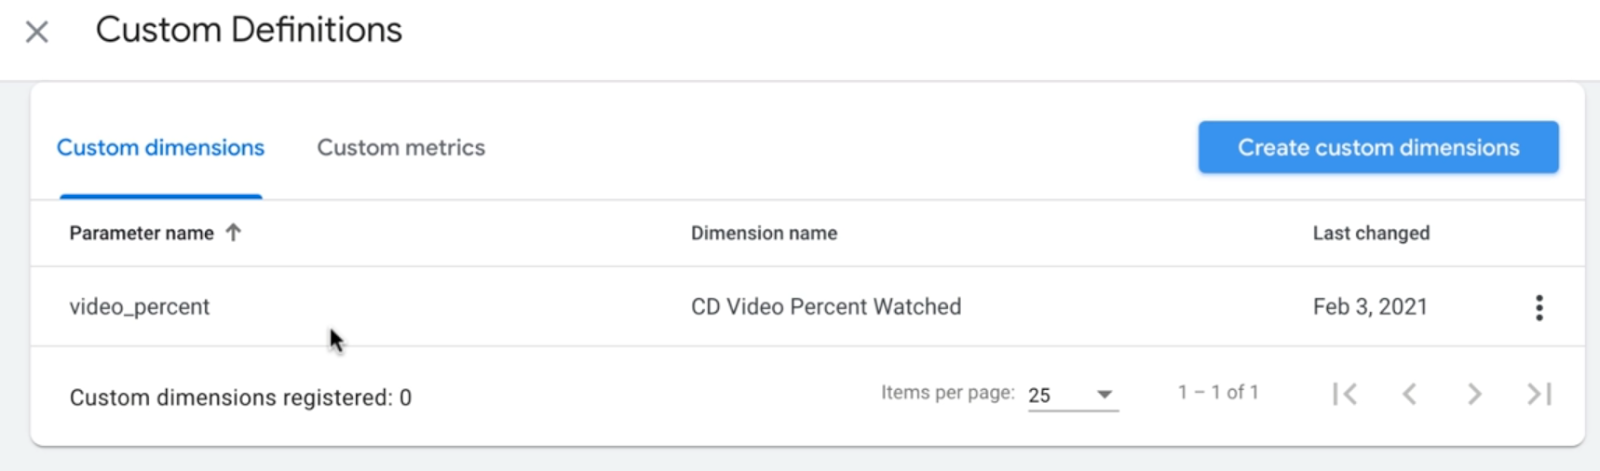
Click Save to save the dimension and then you will see it is now listed on the list of Custom dimensions.
Note that you’ll have to wait around 24 hours for this report to be configured and until you can start to see data coming through. Once it is configured, you’ll see it on the relevant Event page (in this case, video_progress).
Create as many as you like (up to 50), to measure all the parameters you need.