
PAGES AND SCREENS
What are they looking at on your site?
Tracking your page and screen views is an essential part of Google Analytics data collection. In Google Analytics 4, you can do this easily using the pages and screens report.
So how do you use the pages and screens report in Google Analytics 4? You can find this report under Engagement on the left and customize it with comparisons. The information in this report lets you see how popular each page and screen is with your users, which can help you make important marketing, design, and content decisions.
Today we’re going to take you through how to access, read, and customize your pages and screens report in GA4. We’ll also give you some thoughts on how to use the data you’ll collect in this essential report.
What Is The Pages and Screens Report?
The pages and screens report in Google Analytics 4 shows a breakdown of how your website and mobile apps are performing according to page and screen views. A pageview can include an initial load of a page, a reload, or a revisit on that same page.
Screens are just like pages, except here, Analytics is tracking what users are viewing within one of your mobile apps.
Motoring your pages and screens is critical for data analysis. In short, seeing how well your pages and screen are performing lets you know what content is most interesting to your users, but you can gain a lot of insight based on the data you’ll find in the pages and screen report. We’ll discuss this more in the upcoming sections.
How Do I Access The Pages and Screens Report?
Getting to your GA4 pages and screens report is a snap. Just log in to your GA4 property and go to the menu on the left. Then follow these steps:
- Click “Engagement.”
- Click “Pages and screens.”
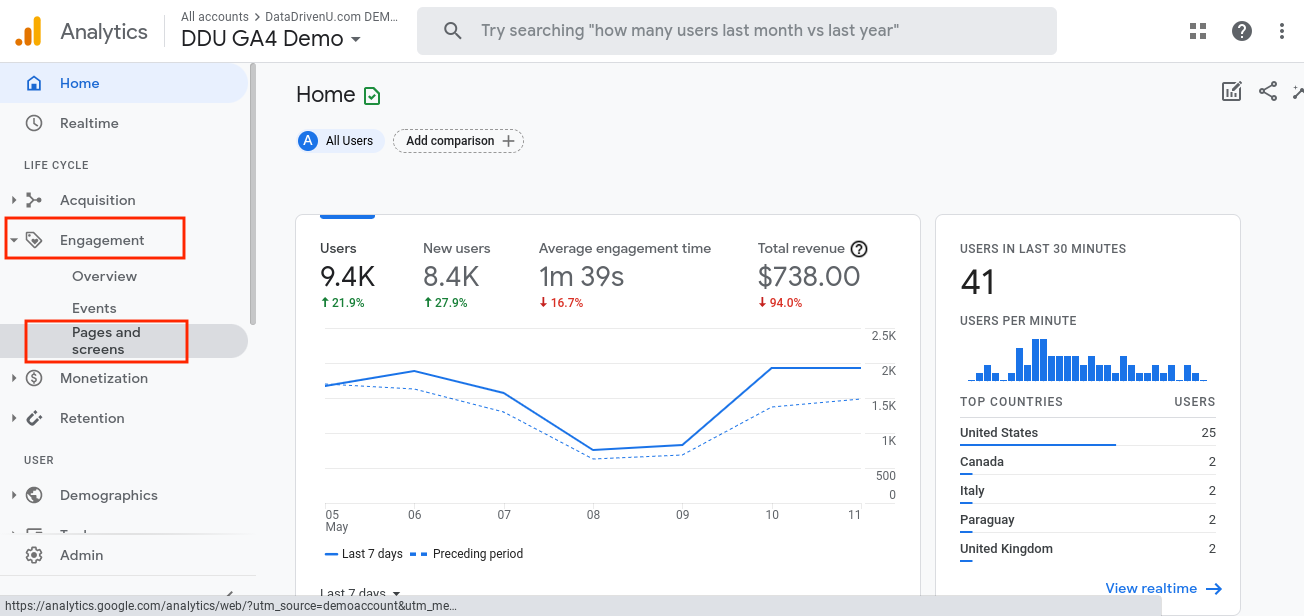
Once you’re inside the pages and screens report, you’ll see a lot of valuable data, and you can also customize this report with ease in Google Analytics 4. We’ll cover how to read the report and what it can tell you in the next sections.

How to Read and Customize The Pages and Screens Report
Okay, so now that you know how to access your GA4 pages and screens report, let’s talk about how to read and customize it.
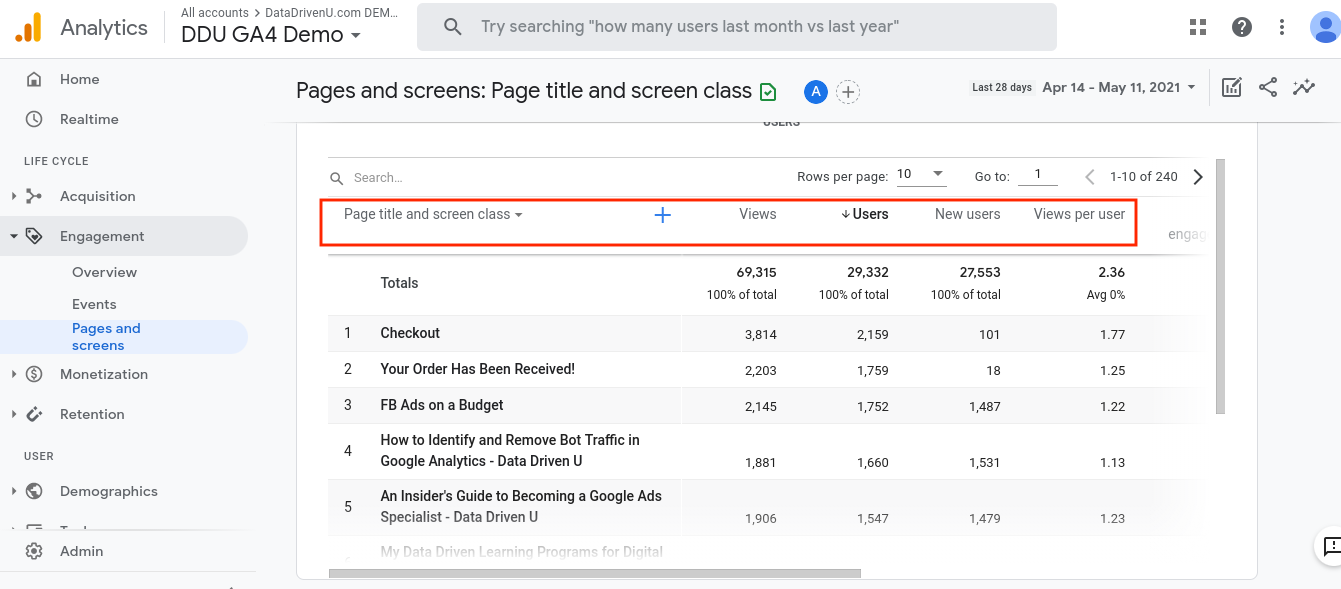
When you first access the report, you’ll see your data broken down according to page title and screen class. This means you’re looking at all the pages on your site, broken down by the web page title and the developer-supplied screen name.
First, you’ll see two graphs side-by-side. The one on the left shows your most popular pages with all users, and the one on the right shows both users and new users.
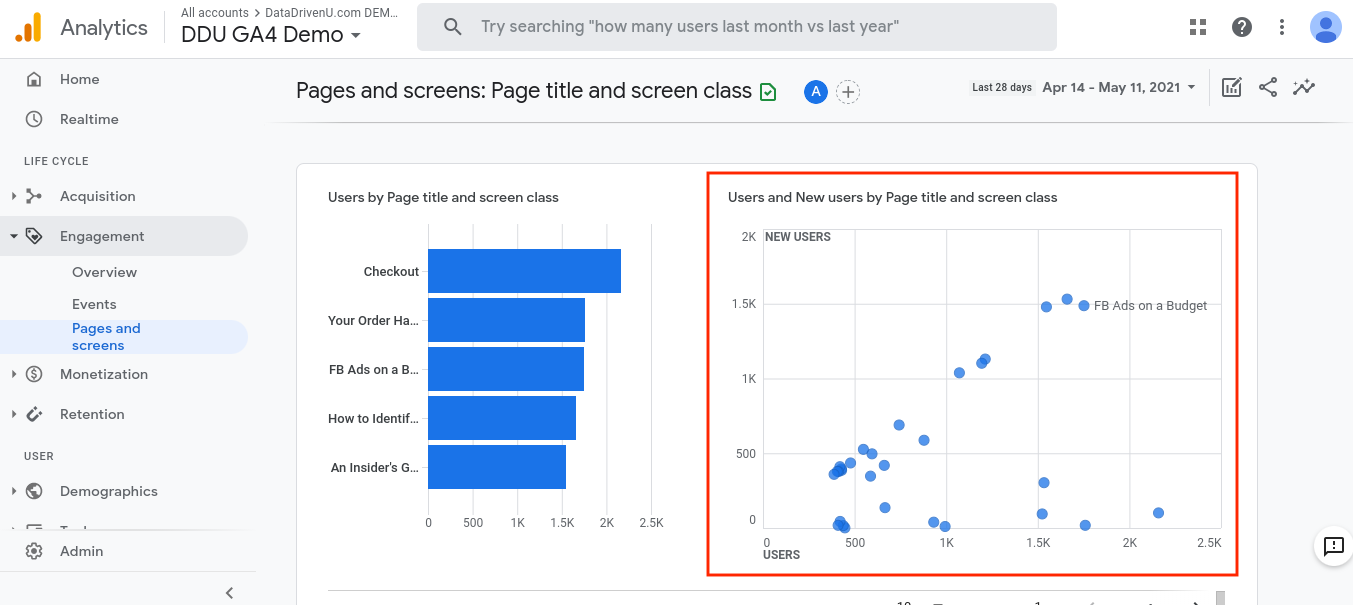
You can interact with both these graphs by hovering your mouse over them. This will show you more precise figures for all of your most popular pages/screens.
If you scroll down, you’ll see a detailed overview of each page/screen on your website/mobile apps. You’ll see data about users, views, new users, average engagement time, event count, and more for each one.
Customizing Your Report
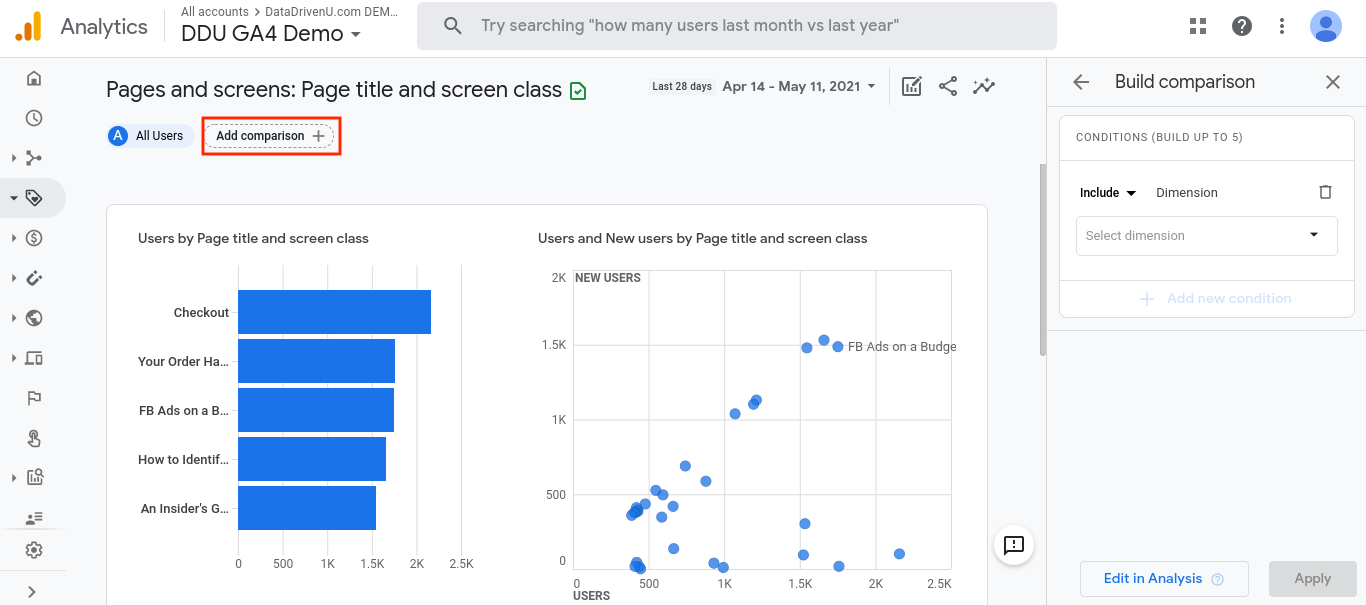
There are several ways you can customize your pages and screens report. First, you can set up comparisons, as you can in all the reports in Google Analytics 4. To do this, simply go to the top and click “Add comparison.”
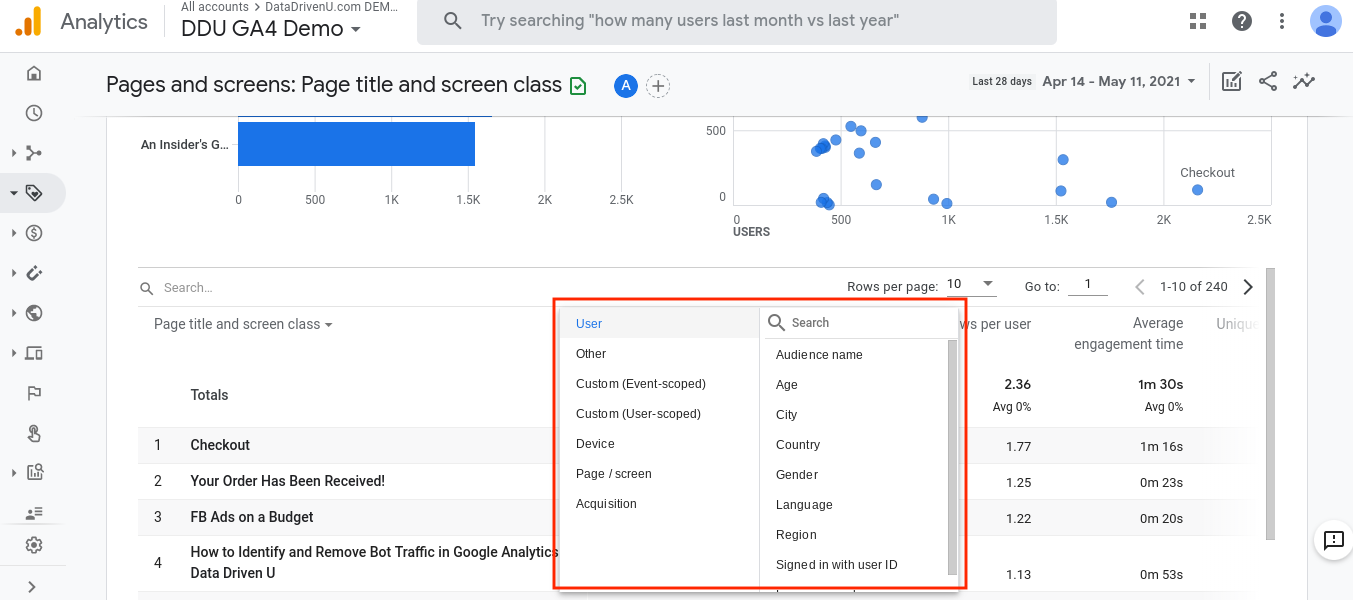
Using comparisons, you can add another layer to each of the visuals on the pages and screens report. This helps you look at specific groups of users or events you want to track more closely inside your report.
For example, say you want to view the pages that are most popular with your female visitors. Just click the “Add comparison” button to get started.
Then, just leave it set to “include,” add the “gender” dimension from the drop-down menu on the right and click “female.” You can add multiple dimensions within the same comparison by clicking “Add condition.”
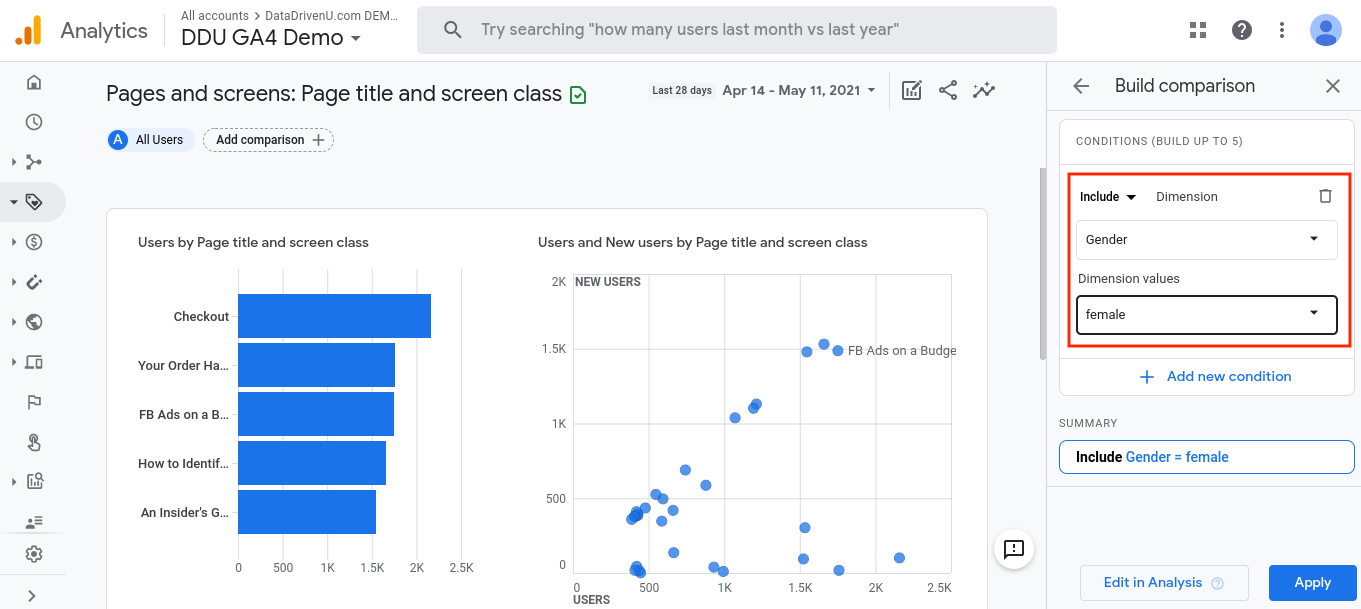
Once you click “Apply,” you’ll be able to see this comparison added to your report.
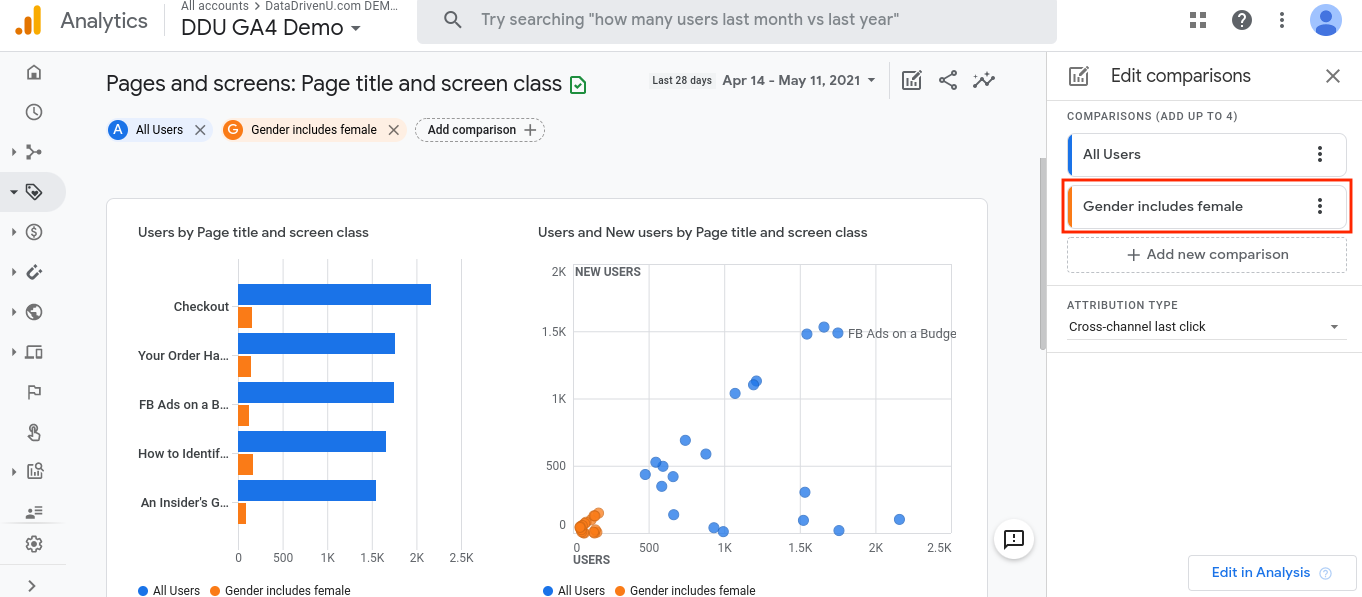
You can easily remove comparisons when you’re ready by clicking the “X” next to it up top.
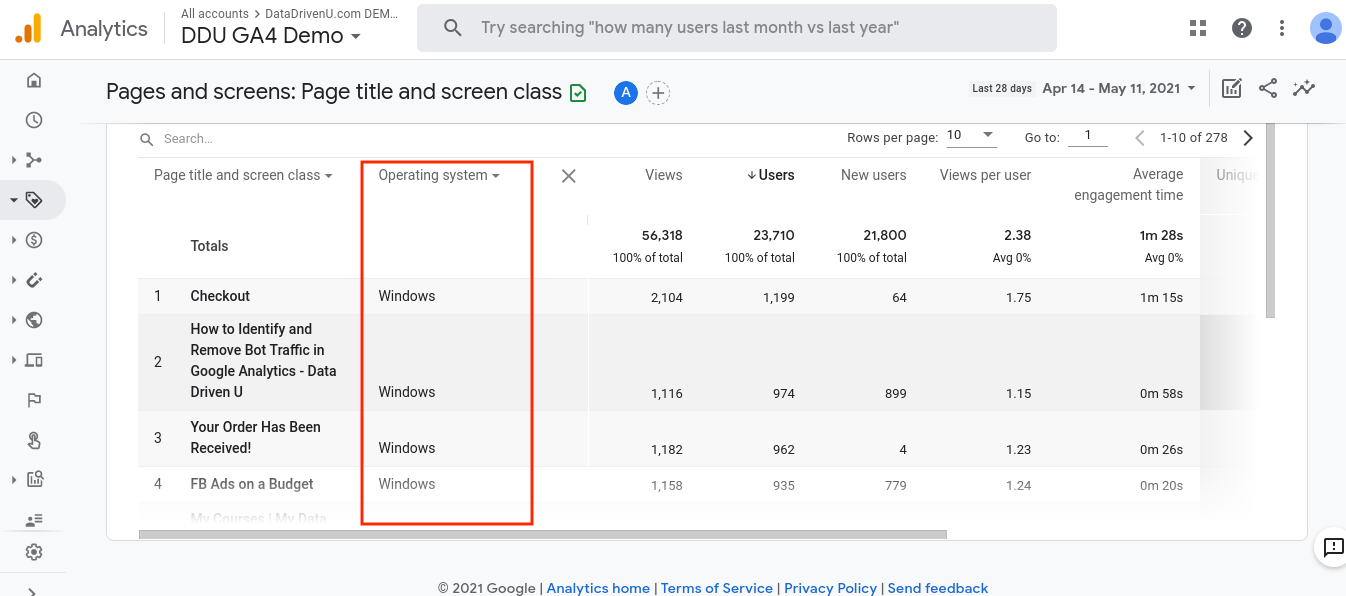
Another way to customize this report is by adding another category to your table. Simply scroll down to the table of all pages and screens at the bottom of the report and click the “+” sign. Here, you can add another dimension to this table.
For example, say you want to see how your checkout page is performing when people use different operating systems. You can select the “Operating system” dimension to gain this insight.
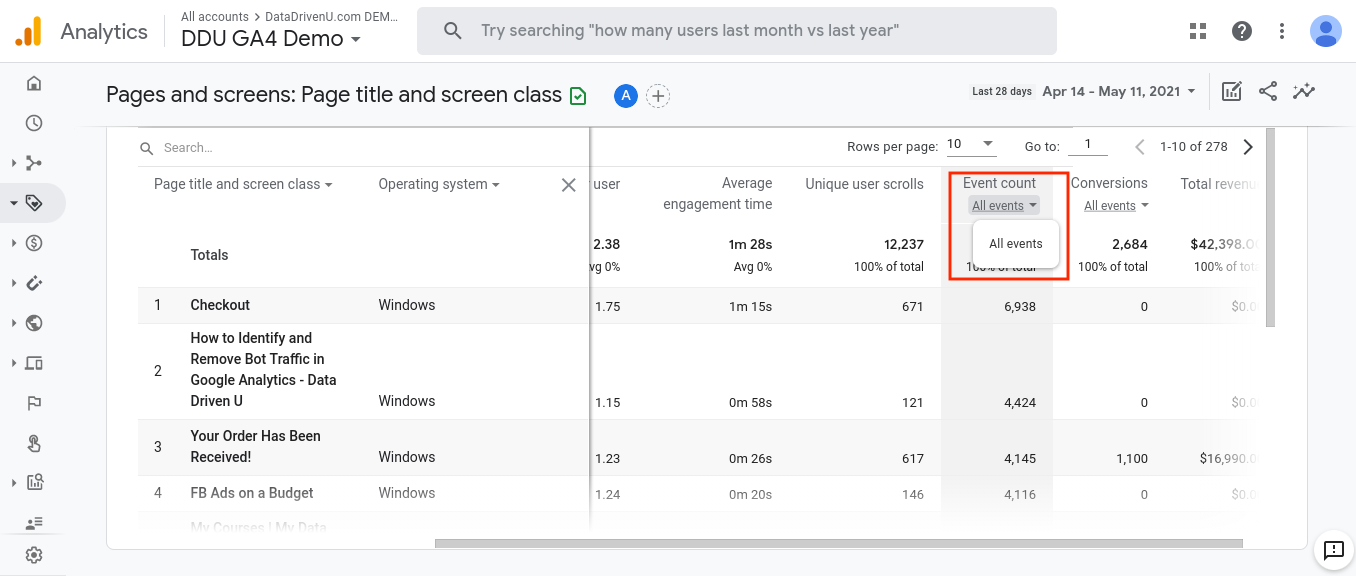
You can also customize which events and conversions you’re tracking by selecting specific ones from the drop-down menu in the bottom table. Just scroll to the right a bit, and you’ll see these options.
Why Is The Pages and Screens Report Important?
Page and screen views are some of the most popular metrics when it comes to data analysis. Tracking them means you’ll gain insight into what your users want to see and interact with.
Page views tell you a lot about the content on your pages. If you have certain blog posts that get a bunch of views, these pages are likely doing very well with organic search. If other blog posts are ranking poorly, you might need to optimize this content to make it longer and more informative with additional keywords.
You can also track how well your pages are doing on your mobile apps vs. your website. In the example we gave above where we added the “Operating system” metric to our pages and screens report, you can not only track the OS visitors are using on their computer but also if they’re using a mobile OS. This can help you see if users are having trouble accessing or interacting with certain mobile screens.
For example, if you notice your checkout page has a high number of views but isn’t resulting in conversion events, it can mean people are having trouble checking out on your mobile app.
You can also track your marketing campaigns, new website formats, and page content optimizations by conducting a pageview analysis. By tracking your page views before and after launching a new campaign or optimizing your site, you can track how users are responding to your efforts.
There are many other ways to use the data you collect in your pages and screens report, so it’s sure to be one of your most valuable stops each time you dive into your Analytics reports.
How is GA4 Different?
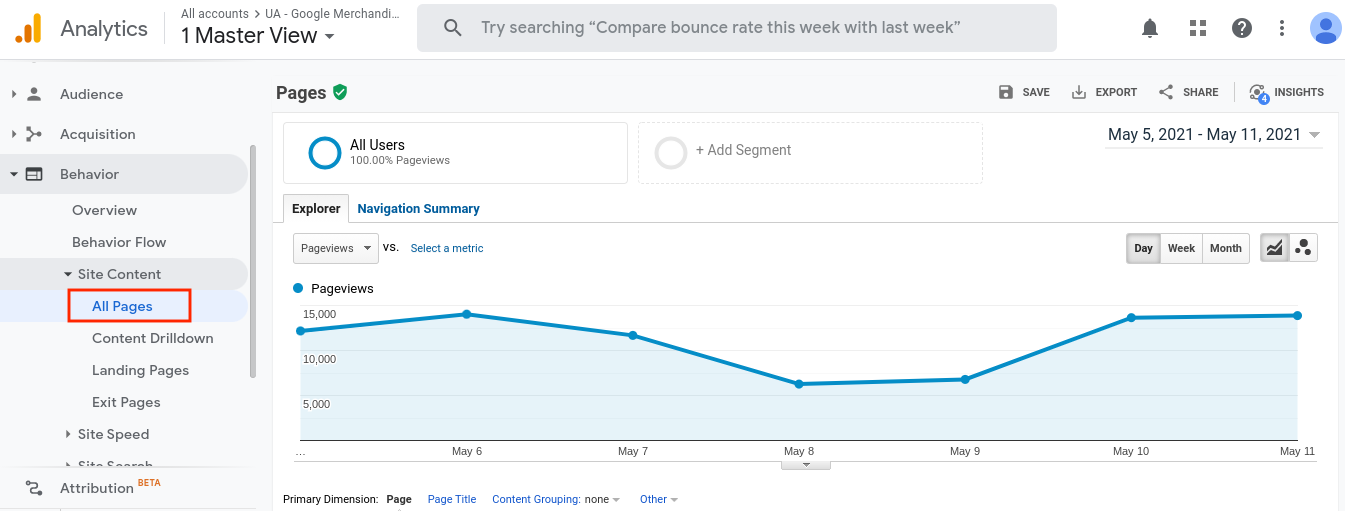
GA4 has made the pages and screens report much like the “All pages” report in Universal Analytics.
However, you’ll notice that a few things are missing from the simplified GA4 pages and screens report. You’ll no longer see entrances, exits, bounce rate, or average time on page. However, GA4 has added some new metrics that make up for losing these and pairs things down to simplify and streamline reporting.
For example, in GA4, you’ll see average engagement time, which is the average time users remain engaged on each page/screen. To learn more about engagement in GA4, check out our post here.
You’ll also notice that for now, there’s no standalone landing pages/screens or exit pages/screens report in GA4. This is likely because GA4 properties are built to be mobile-first, so landing pages have less relevance. It’s also because GA4 has an events-based model rather than being focused on sessions.
Also, note that GA4 properties don’t offer site speed reporting at this time. If you’re using this data, it’s important to keep your Universal Analytics property for the time being so you can continue tracking this information. Using your UA properties along with your GA4 property can offer a more comprehensive view of all your data, so for now, it is something we recommend anyway.
Closing Thoughts
The pages and screens report in Google Analytics 4 is sure to be one of your favorites. This report is very similar to the “All Pages” report in Universal Analytics, but like all the GA4 reports, it has been simplified and made to be user-friendly.
Again, like all your GA4 reports, you can easily customize your pages and screens reporting using comparisons. You can also add more dimensions and customize what you see by interacting with the chart at the bottom of the report.
How are you enjoying the new pages and screens report in GA4? Let us know!