
FUNNELS
Customize your funnels to the greatest extent possible
Following your user’s journey through your site is an adventure, one that’s critical to your data analysis in Google Analytics. One of the best ways to track how users move through your site is by creating a funnel, and in GA4, you can easily craft a funnel analysis report to analyze a specific funnel in depth.
So how do you use the funnel analysis report in Google Analytics 4? You can create a funnel analysis to investigate a specific series of actions you want a user to take. Using the generated report, you can consider your steps and see where users are dropping out of your funnel.
Today, we’re going to walk through how to build a funnel analysis in Google Analytics 4 and what you’ll see in your funnel analysis report.
What is a Funnel Analysis in Google Analytics 4?
A funnel is a specific path you want users to take while visiting your website or mobile app. For example, if you want to track users who look at a specific product and make a purchase, you might set up a funnel to track a series of events like “view product” > ”add to cart” > ”purchase.”
In Universal Analytics, funnel reports were arguably flawed and didn’t offer much insight. But luckily, GA4 provides in-depth funnel analysis reports. With these, you can build funnel reports anytime, and they’re very easy to adjust.
Funnel analysis reports really are an excellent feature of GA4. You can adjust these reports in great detail in your GA4 property. They're also very accessible and insightful.
Funnel analysis reports let you see when a user is bouncing away from a series of actions you want to see them complete. Once you see where you’re losing users in a particular funnel, you can use that information to set up a remarketing campaign or make other adjustments to increase the success of your funnels.
Creating a Funnel Analysis Report in GA4
To create a funnel analysis report, go to your GA4 property. On the left, click “Analysis” > ”Analysis Hub.” Then select “Funnel Analysis.” Here, you will see a sample analysis with some configurations already set up.
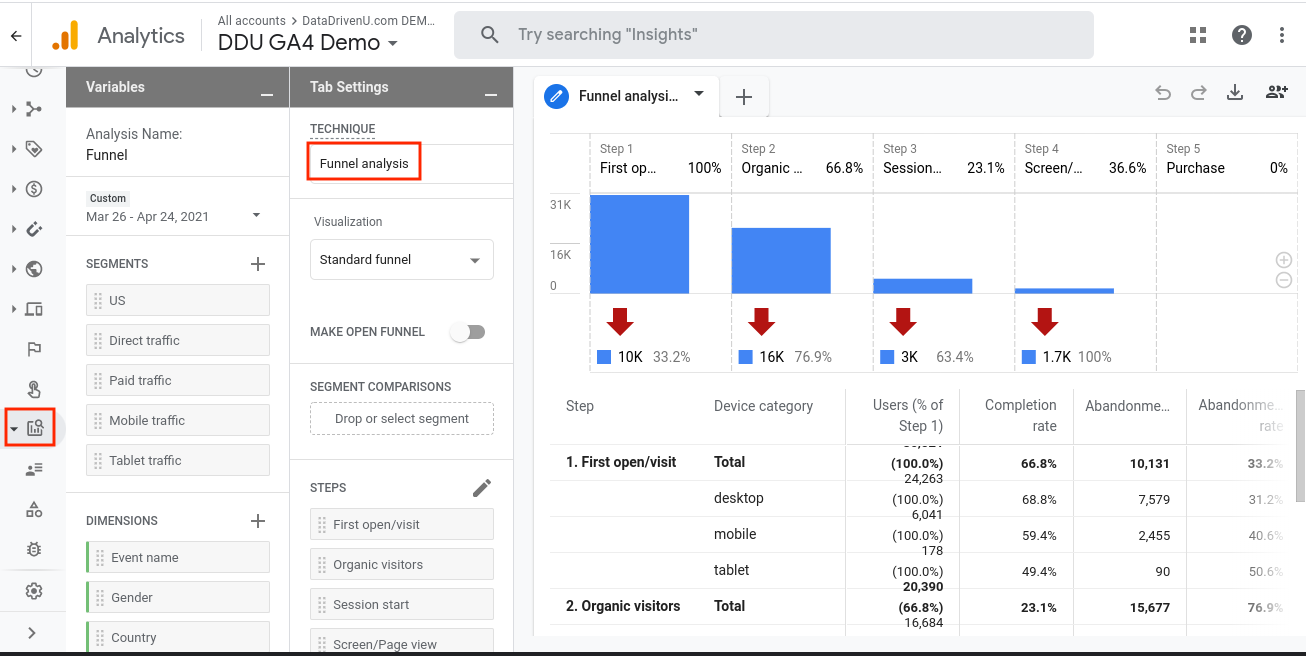
To start a new funnel analysis, click the “+” button and select “Funnel analysis.”
You’ll notice there are three tabs available here. You have:
- Variables: This where you set up segments, dimensions, and the date range for your funnel analysis.
- Tab settings: Here, you can add steps to your funnel analysis and configure how you view your funnel data.
- Output: This is the funnel analysis report that’s based on how you configure the other two tabs.
Let’s dive more into the Variables and Tab settings to understand how you can configure your funnel analysis.
Variables
Let’s start with the first tab, Variables, and discuss the different choices you need to make here. You’ll see these options when configuring your Variables:
- Name: First, you can name your analysis anything you like.
- Date Range: Next, you can select any date range you want to see.
- Segments: You also can create segments. This allows you to compare different groups of users and how they’re behaving. You can select from the segments already listed or create a segment by clicking the “+” button.
When you click the “+” button, you’ll see that you can create a custom segment or you can select from suggested ones.

If you choose to create a custom segment, you have three options:
- User segment: With this option, you can create a segment based on user criteria. For example, you can look at users from a specific country or users who’ve previously made a purchase.
- Session segment: You can also create a segment according to session. You can customize these sessions however you want. Analytics will track sessions that set off certain event triggers or include users that meet particular criteria.
- Event segment: If you only want to focus on events in your segment, this is the ticket. For example, maybe you want to check out users who have canceled their subscriptions to your services.
- Dimensions: You’ll also see the dimensions option under “Variables.” Dimensions are determined by the attributes of something–a user, an event, a product, etc.
Note: If you want to include a dimension, you have to include the dimension in the Variable column first. Do this by selecting the “+” sign, selecting your dimension, and then clicking “Apply.”
Tab Settings
Okay, so now that we’ve discussed “Variables” in your funnel analysis, let’s talk about “Tab settings.”
- Technique: With this, you can change the analysis type, but since we’re looking to build a funnel analysis, we’ll stick with that.
- Visualization: Here, you can choose between Standard funnel and Trended funnel. Standard funnel is the style you’re likely familiar with. It comes along with a bar chart that shows the users who completed each step in your funnel.

Note: The Standard funnel view can make analyzing your data over time challenging, so the Trended funnel view can also be very helpful. You can change your view as needed.

- Make an Open Funnel: All of your funnels will be closed by default. This means that Analytics will only count it if your user completes all the steps in your funnel. If you want to see users who enter into the funnel at any point, you can make an open funnel.
- Segment comparisons: Here, you can compare up to 4 segments that you’ve already set up in the “Segments” section back in the “Variables” tab. You can drag and drop a segment from the Variables tab or just double-click on them.
- Steps: The steps are the meat and potatoes of your funnel analysis report. This is what makes up the funnel. You can delete steps by clicking the “X,” and you can add and edit steps by clicking the pencil icon. When you add or edit steps, here is what you’ll see:
- Name: You can name each step in your funnel analysis.
- Configure conditions: You can start by configuring the conditions that Analytics already has available.
- Add new condition: If you want to add more conditions to each step, you can by clicking the “And” button and then click “Add new condition.” You can also edit the parameters here.

You’ll also notice a line of three dots in the top-right corner of each step. You’re given several options:
- Copy step
- Remove step
- Add step above
- Add step below

When you add another step, Analytics will present you with the same options as the first one, but you’ll also have some additional choices.
First, you can decide if the step directly or indirectly follows the one before it. You can also determine the amount of time you’ll allow between steps—anywhere from 5 minutes to many days. Note: you can leave the time box unchecked if you don’t want to add this parameter.
Once you have your funnel steps set up the way you want, click “Apply” in the top-right corner.
- Breakdown: Here, you can see your funnel analysis data based on a single dimension. You can drag-and-drop dimensions from the “Variables” section, and you can also select how many rows per dimension you want your report to show.
- Show elapsed time: You can enable this option. If you do so, you’ll see the average elapsed time it takes your users to move from one step to another.
- Next action: You can check out what users do after completing a step in your funnel. For example, you can drag the “Event name” dimension over and then hover your mouse anywhere on your report. This will show you the next 5 most popular events.

Funnel Analysis Report
Now that you know how to set up your funnel analysis report, you can dig into it.
First, you’ll notice that you can hover over the chart in your funnel analysis to look more closely at the details. You can also click through the individual steps in your funnel analysis directly above the chart.

Another place you can click is directly below the funnel analysis chart. You can right-click to interact with your data, and you can also create a segment right here or view users and abandonments.

Note: If you have your funnel set as an open funnel, you won’t be able to create segments this way.
Creating Funnel Analysis Reports in GA4
To sum up, creating a funnel analysis report in Google Analytics 4 is pretty straightforward, but you have a lot of options. Your “Variables” section lets you change the date range you want to view and create segments to compare distinct user groups.
In the “Tab settings” section, you can set up your steps and also control how you view the data in your funnel analysis report.
What funnels have you set up in Google Analytics? Let us know below!