
MONETIZATION
How does your site make money?
The monetization report is one of the most useful features Google Analytics 4 has to offer. Here you can see details about e-commerce, subscription, and ad revenue. This report lets you quickly see how much money you’re generating, and you can track each revenue source with ease.
How exactly do you use the monetization report in Google Analytics 4? You’ll need to set up revenue-based events before you can see any data. Once you have your events set up, you will start seeing data in this report which can be accessed in the left-hand menu.
Today, we’re going to give you an overview of the monetization report in Google Analytics 4. This report is large and insightful so come with us to learn about all the ways you can dive into your revenue details.
What is The Monetization Report?
The Google Analytics 4 monetization report holds some of your most valuable data and it’s sure to be one of your most heavily monitored areas. You can see your e-commerce, subscription, and ad revenue all at once in the monetization report. You can also track revenue over time to identify user trends and track the success of your campaigns.
By setting up a few events in your GA4 property, you can closely monitor essential conversions like purchases. Also, you can set up comparisons in your monetization report just like all the reports in GA4. Using comparisons means you can look at specific users or focus on an essential event.
The monetization report is large and has a lot of customizable elements, so no matter what revenue you want to monitor, you can do it here.
How Do I Access The Monetization Report?
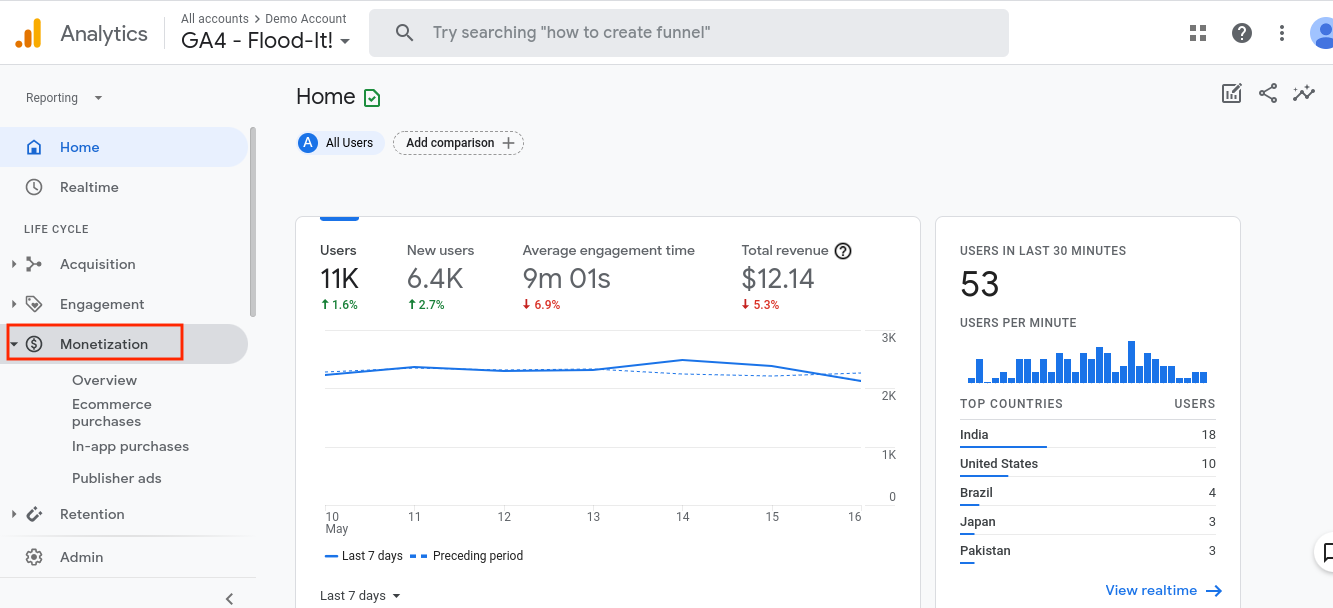
You can get to your monetization report through your left-hand menu in Google Analytics 4. Just click “Monetization,” and you’ll see a menu of four options. We’ll dive into each of these options in more detail in the next sections.
Collecting Data for The Monetization Report
An important detail about the monetization report is that you have to set up a few things for it to begin collecting data. Until you’ve done that, you won’t see anything.
To collect data for your monetization report, you’ll have to set up several events, but they’re ones you probably would’ve set up anyway. Google provides a full list of recommended events here to get you started. You’ll want to monitor important events for purchases like “begin_checkout.”
Note: To monitor your purchases, make sure you set up a “purchase” event. This is very similar to the “ecommerce_purchase” event you’re used to, but Google has given it some new insights.
Also, for all your events, make sure they’re set up to fire as a conversion so that Analytics can track it properly in your monetization report.
To test that you’ve set everything up correctly, just go to your monetization report. If you’re collecting data about revenue, transactions, and products, you’re good to start your analysis.
How to Read and Customize The Monetization Report
Your monetization report is huge, and there are a lot of ways you can interact with it and customize it. You’ll want to spend some time getting to know this report intimately, but as an overview, let’s walk through the different tabs available in this report.
Overview
The first tab you’ll see in your monetization report is the overview tab. Up top, you’ll see tabs you can click between, including total revenue, e-commerce revenue, and total ad revenue. You will see your graph shift as you move between these options, and you can hover over it at any point to get a more detailed snapshot of your data.

When you scroll down, you’ll see more graphs and charts laying out information about your revenue. When you explore these metrics, you can customize them further to see precisely the data you want to monitor.
Also, like all the reports in GA4, you can customize your monetization report using comparisons, which are akin to segments in Universal Analytics. Comparisons let you look at a group of users or investigate specific events and conversions.
For example, say you want to look at the purchasing habits of people in a particular country. Just click the “Add comparison” button at the top of your report and then fill in your desired dimension in the window on the right.
You can add multiple conditions to customize the comparison further, and just click “Apply” when you’re ready. You’ll instantly notice a new dimension included in the report.

Ecommerce Purchases
Your next tab is e-commerce purchases. Here, you’ll be data specific to item views. To generate data for this section of the report, you’ll need to set up certain events. Implementing them will let you see the most popular products on your site and check out the performance of your promotions.
Google provides a list of events and associated parameters that will help you begin collecting data for your e-commerce purchases here.
Notice that any comparisons you set up in the overview tab will carry over to this new section of the report.
In-App Purchases
The in-app purchases section of your monetization report lets you see the number of purchases being made in your apps. Since GA4 is mobile-first, you’ll notice this section of the report is pretty robust.
You have two graphs up top that let you see your purchase trends over time and also compare your quantity to revenue. Again, you can interact with these graphs by hovering over them.

You can also customize the chart at the bottom of your in-app purchases section. Just click on the “+” sign to add a new dimension.

Publisher Ads
Here you’ll be able to see data related to any ads you have configured in GA4. To see data here, you’ll need to link your GA4 property to Google Ads. You can set up your Google Ads linking in your GA4 property by going to “Admin” on the left. Under your “Property” heading, you’ll see the option to link to Google Ads.

Once you have Google Ads linked to your GA4 property and events set up as we explained above, you’ll be able to see data in this section of your monetization report. You can interact with the graphs in this section as we’ve shown in previous sections. You can also add comparisons or add additional dimensions to the chart at the bottom.
Why Is The Monetization Report Important?
Your GA4 monetization report is arguably the most essential report in your Analytics property. This report tells you all about your revenue and how you’re making sales, and it lets you quantify your conversions in real terms. If you want to review and revamp your marketing strategy, this is one of the most important areas in all of Analytics.
GA4 offers some built-in insight thanks to the new design. The most significant boost to the monetization report is the fact that GA4 lets you combine your mobile apps and website altogether in a single property. This means you can track purchasing habits across platforms with ease.
You can also track behavior over time in the GA4 monetization report. Monitoring changes can help you see how users are reacting to your marketing campaigns and site optimization.
How is GA4 Different?
If you’ve just started using GA4, you’ll notice the monetization report is very similar to the e-commerce report you’re used to seeing Universal Analytics. One of the benefits of GA4 is that you can now collect historical data in the monetization report. This is super helpful for observing trends over time and seeing how your marketing and site optimization efforts are paying off.
Additionally, as we mentioned above, because GA4 combines your website and mobile apps into a single property, monitoring your revenue across platforms is much easier now. You’ll also notice that this report is more comprehensive than the UA e-commerce report, but at the same time, it’s been simplified and made to be more user-friendly.
Using The Monetization Report in Google Analytics 4
Your monetization report is the most straightforward way to monitor your revenue in Google Analytics 4. You’ll need to set up events and set them as conversions to see data start to appear in this report.
Once inside the report, you’ll find data similar to the e-commerce report in Universal Analytics, but in GA4, you can easily monitor your revenue across your website and mobile apps. You can also keep an eye on your monetization over time, which is a very helpful insight provided by the new platform.
How are you enjoying the GA4 monetization report? Let us know!