
TECH
Understand the details of your users and their browsers
Understanding your user’s technology might not seem like the most important part of data analysis at first blush. But the truth is, tech details can be essential to making sure your user’s experience is smooth and engaging, which means a whole lot to every website out there.
So how do you use the tech report in Google Analytics 4? You can click on the tech report in the left-hand menu and customize it with comparisons. Using the information in your tech report, you can make sure your visitors have a smooth experience on your website and mobile apps.
Today, we’ll discuss the GA4 tech report in-depth and talk about how to read and customize what you see. Keep reading to learn how to use your tech report, which is sure to be one of your favorite places in the new GA4 interface.
What is The Tech Report?
The Google Analytics 4 tech report tells you all about your audience’s technology. It lets you know what browsers your users prefer, their screen resolution, and more.
If you’re a long-time Analytics user, the GA4 tech report will be very similar to the technology report you’re used to seeing in Universal Analytics. Armed with your user’s technology information, you can do all kinds of website troubleshooting, such as making sure your site is mobile-friendly. You can also use the data in your tech report to make important marketing and content decisions for your business.
In our next sections, we’ll show you how to read and customize the GA4 tech report. We’ll also discuss some ways you can use this report to influence important decisions moving forward.
How Do I Access The Tech Report?
To access the tech report in Google Analytics 4, follow these steps:
1. Under “User,” click “Tech.”
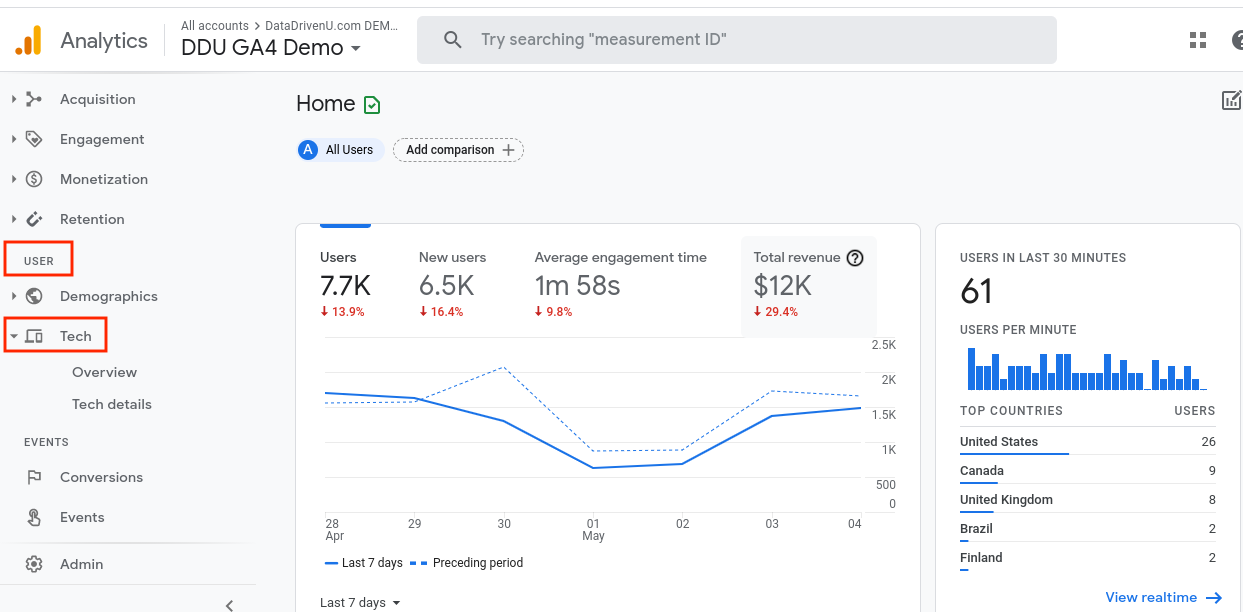
2. You can then select “Overview” to see a comprehensive overview of your user’s operating system, platform, and other key elements. You can also choose “Tech details” to see a breakdown by browser.
How to Read and Customize The Tech Report
In the Tech section of GA4, you can view a lot of critical information about your users. Let’s break it down by Overview and Tech details, the two main categories.
Overview
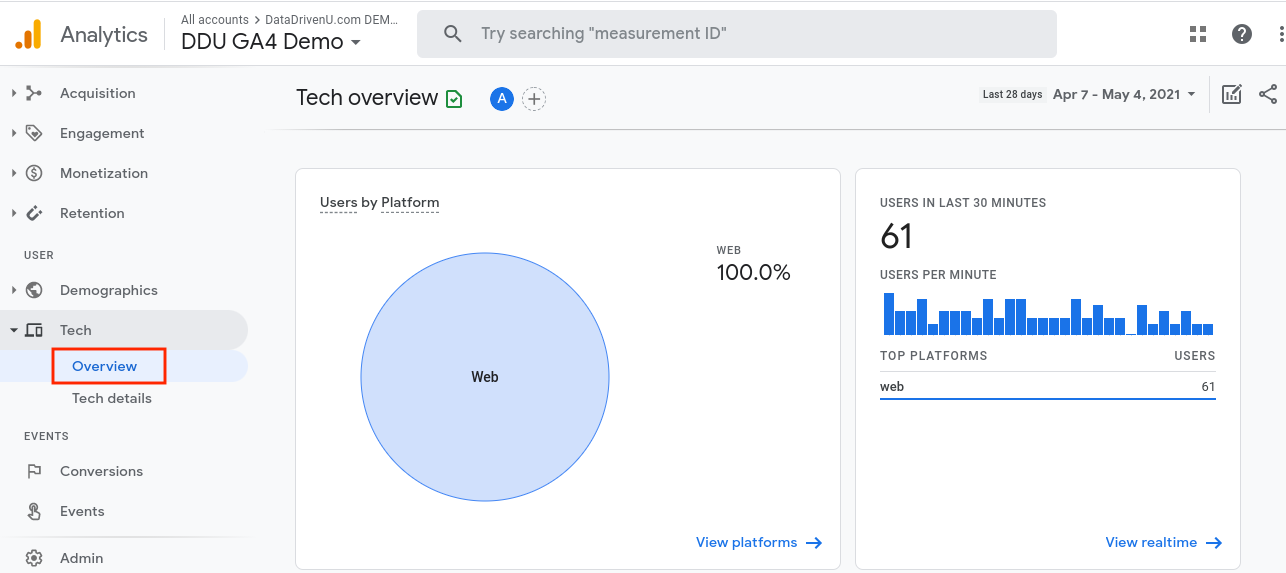
When you select “Overview,” you’ll notice a few important things right away. First, you’ll see what platform your visitors are using in a pie chart. You’ll also see a graph of your users over the past 30 minutes and the option to view this information in a realtime report.
When you scroll down, you’ll be able to dig into your user’s operating system and their platform/device category (Ex. Web/mobile). You’ll also see the browsers your users prefer and the device category (Ex. desktop, mobile, and tablet). Scrolling further lets you see even more details, including screen resolution, app version, and device model.
Tech Details
When you click on “Tech details,” you’ll first be greeted by a chart that shows users by browser over time.
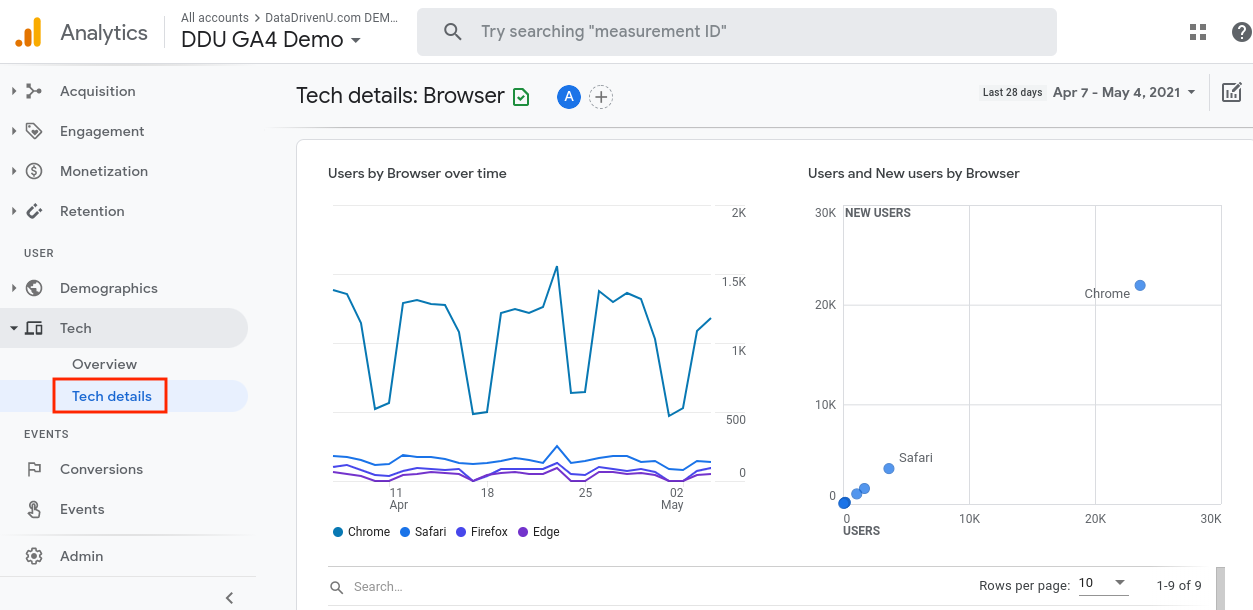
You’ll also notice a breakdown of users and new users by browser. Scrolling further will allow you to view more of your user’s browser data. You’ll see important details here, like engaged sessions and engagement rate.
You can also add a comparison in the “Overview” or “Tech details” section to customize your tech report. Just click the “Add comparison” button at the top.
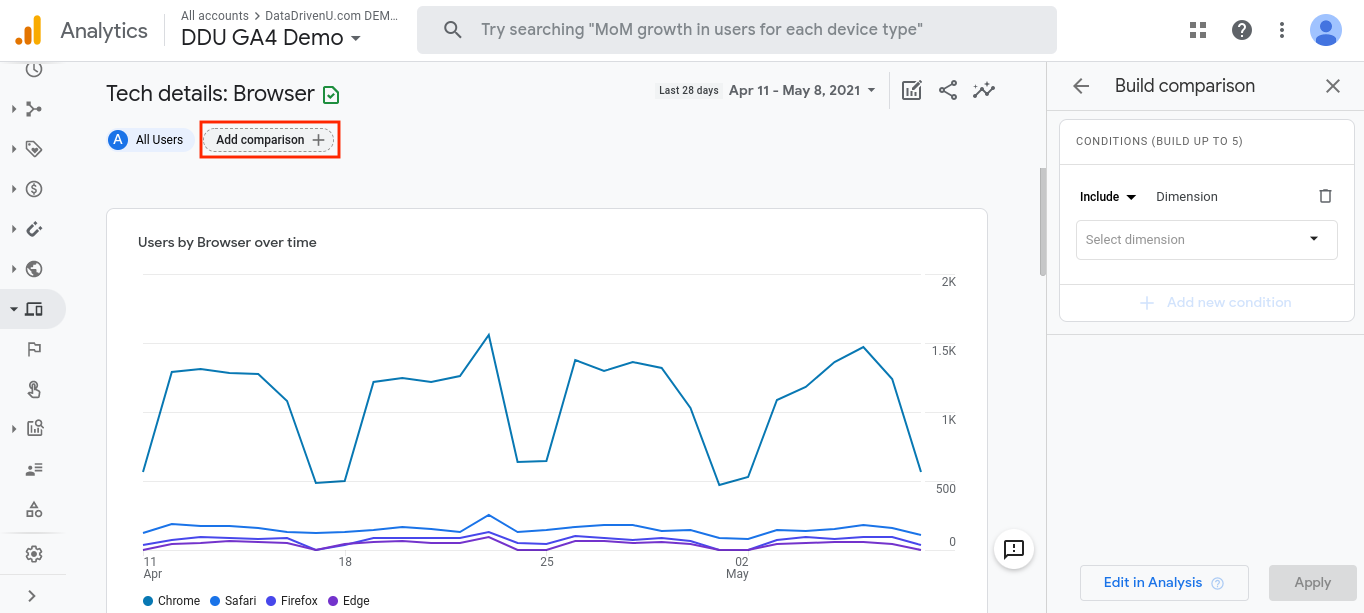
Then, simply include the dimensions you want to view in your tech report. For example, you might have launched a remarketing campaign aimed at users from a particular area. Here, you can choose “city” or “country” from the dimensions drop-down menu to see those users alongside the rest of your tech report. Simply click “apply” when you’re ready to see this comparison integrated into your tech report.

Why Is The Tech Report Important?
There are many reasons you should be interested in your GA4 tech report. The most evident is to make sure you’ve optimized the platforms your visitors are using.
Understanding Mobile Traffic
I've been caught off guard before when I see how my website loads on someone else's phone. Different phones have different quirks and if you notice that you've got a lot of users using a specific device, it's worth looking into. There are dozens of tools that will help you do this but I find this responsive tester from BrowserStack.com to be the most user-friendly.
Don't Forget About Tablets
By this point, everyone is well aware that mobile phones are going to be a big part of any website's traffic. But what often gets overlooked (at least by me) are tablets.
But the number of tablet users is increasing every year and website owners need to be ready. By using the Tech Report in GA4, you can quickly see what percentage of your users are on tablets vs mobile or other devices.
User Experience Matters, Too
You can also dive into your tech report in more detail to see where your site is falling short. For example, if you see a particularly low engagement rate on a certain browser, you know there’s a compatibility issue. The same goes for your mobile apps. If users aren’t resulting in engaged sessions on your mobile app, there could be an issue with how your app is functioning.
You can also view your conversions in your tech report. If you see your users are not resulting in conversions on a particular browser, they might not be able to engage with your site properly.
For example, say you have a contact form submit event set up. If that conversion is performing poorly with Firefox, it can mean that the contact form isn’t working on that browser or more likely isn't easy for the user to use.
Another detail you should monitor is screen resolution. You’ll want to make sure your site is set up to cater to the majority of your visitors, so it makes sense to format your site so it pairs best with the most popular resolution. Check things like your font size to make sure it’s optimized for the screen most people have.
How is GA4 Different?
The tech report in GA4 is very similar to the technology report in Universal Analytics. There are a few notable differences, though. First, you’ll notice that GA4 doesn’t include bounce rate in the tech report. Instead, you see engagement rate in GA4.
Also, you’ll notice that GA4 looks at “engaged sessions” rather than just “sessions.” This is a more precise way to look at your data, and engaged sessions are arguably more meaningful. For a session to be considered “engaged,” the user must do one or more of the following:
- Engage actively on your website or mobile app for over 10 seconds.
- Have two or more screen or page views.
- Fire a conversion event.
For more information about engaged sessions, check out our post on engagement rate here.
Using The Tech Report in Google Analytics 4
Using the tech report in GA4 is quite simple. You can view what technology your users prefer and dive into your data to ensure things are running smoothly on your site.
Remember, you can customize your tech report using comparisons, so you can look at specific groups of users while inside this report. If you’re used to Universal Analytics, the tech report will be very familiar, and it comes along with a simplified design you’re sure to appreciate.
How are you enjoying the new tech report in GA4? Let us know!